A new world of work – challenges and opportunities
European Working Conditions Survey 2024
First Findings


Introduction
The world of work is being reshaped by digitalisation, artificial intelligence and algorithmic management. As these changes generate both opportunities and challenges, is it vital to understand how workers are affected and how policies can respond. For 25 years, Eurofound's European Working Conditions Survey (EWCS) has been providing the evidence needed to support a fair and sustainable future of work.
EWCS 2024 confirms that one in five workers engage in telework, offering flexibility but also increased risks of blurred boundaries between work and private life. It reveals how technology is not destroying jobs but rather is creating new tasks. And it shows how algorithmic management - while still limited overall - is already influencing task allocation and performance monitoring in certain sectors.
Above all, the EWCS highlights the central role of job quality. As the European Commission’s Quality Jobs Roadmap will explore, the survey finds that it's not all about pay: what workers most value are safe and supportive working environments. These findings underline the need for policies that not only address technological change but also protect and strengthen the fundamental aspects of job quality.
This EWCS first findings digital story provides an overview of the initial analysis of the EWCS 2024 data. For more detailed information:
The digital workplace


Key findings
While only 3 % of employees in the EU-27 telework on a full-time basis, larger shares are engaged in regular telework, also known as ‘hybrid work’ (9 %) or occasional telework (16 %).
Despite the considerable hype surrounding generative AI, only 12 % of workers report using AI tools in their job. However, there are significant disparities at country level, with the rate of usage ranging from a high of more than 20 % in some countries to less than 5 % in others.
The impact of technology appears to be more positive than is commonly perceived. The data show that technology creates more tasks than it removes and facilitates increased interaction among workers.
Developments in telework
The characteristic features of telework are the use of computers and telecommunications to change the usual location of work, the frequency with which the worker is working outside the employer’s premises and the number of places where workers work remotely (mobility) (Eurofound, 2022a). Using this definition, employees can be grouped into various categories of teleworkers, including those listed below.
The total prevalence of telework is similar for women (28 %) and men (27 %) but it is higher for employees aged between 30 and 54 (31 %) than for those in other age groups (16–29 years: 20 %; 55–64 years: 26 %; 65+ years: 24 %). Teleworking is more common among managers (60 %), professionals (57 %) and technicians (40 %) and in sectors such as financial services (61 %), education (49 %) and other services (43 %).
Despite the many potential benefits of remote working for employees, including better work–life balance and more autonomy over when and where to carry out certain tasks, the EWCS 2024 data show that regular telework (hybrid work) and occasional telework is accompanied by a blurring of boundaries between work and private life.
Those carrying out regular (hybrid work) and occasional telework are more likely to work during their free time to meet work demands, to be contacted outside of working hours for work-related reasons and, in a small number of cases, to change private and family activities to accommodate work-related requests. While the differences between men and women are generally minimal or none, it is worth noting that the blurring of boundaries between work and private life are more prominent for women who regularly telework (hybrid work); in particular, they work in their free time to meet work demands (Figure 25).
Disparities in the use of generative AI
Despite the increasing hype surrounding generative AI, the survey data show that the use of such tools by workers remains relatively low, with only 12 % of workers reporting that they use them. However, there are large differences in prevalence rates across countries: at least one in five workers report using generative AI tools in their work in countries such as Luxembourg, Sweden, Belgium, the Netherlands and Denmark (which have a greater presence of knowledge-intensive sectors); other countries, such as Greece, Italy, Portugal and Romania, have much lower rates (5 % or lower) (Figure 26).
Generative AI tools are also more likely to be used by men and workers in younger age categories (Figure 27). Younger workers often exhibit greater familiarity with emerging technologies, including generative AI, due to growing up in a digital environment.
Men are more likely to use AI than women.
Prevalence of algorithmic management practices
The three forms of algorithmic management captured in the survey are not that widespread in European workplaces. Some 17 % of workers report that a computer programme monitors their work performance to a large or some extent, while 16 % report that a computer programme is used to allocate their work tasks. A lower share of workers (10 %) report that a computer programme determines when they have to work to a large or some extent.
In terms of sector, the use of a computer programme to a large or some extent for work task allocation and performance monitoring is most prevalent in financial services, at 34 % and 35 %, respectively, whereas automated scheduling of work is most common in the transport sector (18 %). This is also a sector with a higher-than-average proportion of workers reporting automated task allocation and performance monitoring to a large or some extent (Figure 28). Among the 26 % of respondents who reported that some elements of their work are decided by a computer programme, just over half (15 %) stated that there is a clear procedure to raise issues in the event of a disagreement with automated decisions.
Impact of technology
Countering the narrative that technology may destroy tasks and eventually jobs, the data show that technology creates more tasks than it removes (Figure 29). Some 43 % of workers report that technology has created new tasks in their job to a large extent or to some extent, while 31 % say that technology has removed tasks in their job to a large extent or to some extent.
Men are somewhat more likely than women to report the impact of technology to a large or some extent, both in terms of removing tasks (32 % of men versus 28 % of women) and creating new ones (44 % of men versus 41 % of women). The data also contradict the common assumption that technology use leads to greater isolation or alienation at work. Instead, it shows that technology facilitates increased interaction among workers, with 48 % of respondents reporting this to a large and some extent.
Technology is creating more tasks, not destroying jobs
Worker's health and well-being


Key findings
The subjective well-being of workers continues the upward trajectory seen in previous editions of the survey. The average score in 2024 was 69.4 (out of 100), compared with 65.5 in 2010 and 68.7 in 2015.
Musculoskeletal problems are the most prevalent health issue reported by workers in the EU.
A gender difference exists with regard to the reporting of health issues: women are more likely than men to report health issues, in particular when it comes to headaches or eyestrain (54 % for women and 41 % for men) and anxiety (26 % for women and 16 % for men).
While almost two thirds of respondents (63 %) do not feel that work has an impact on their health, negative effects can be seen in certain sectors: transport, health, agriculture and industry are sectors where up to almost one third of workers report that work affects their health negatively.
Psychological well-being
Measuring subjective well-being is important because it is closely connected to both physical and mental health. The EWCS uses the World Health Organization-Five Well-Being Index (WHO-5), which assesses three key aspects (measured on a scale from 0 to 100):
- ‘Positive mood’ (including good spirits and relaxation)
- ‘Vitality’ (characterised by being active and waking up feeling fresh and rested)
- ‘General interest’ (being interested in things).
On average, the subjective well-being of workers in the EU in 2024 was 69.4 (out of 100 points). This has increased over successive editions of the survey (65.5 in 2010 and 68.7 in 2015).
Men score slightly higher than women (70.6 compared with 68.0). Younger and post-retirement age workers have the highest scores, while prime age and pre-retirement workers have the lowest scores. This U-shape of subjective well-being scores by age category is observed for both men and women.
Reported health problems
Musculoskeletal problems are the most prevalent health issue reported by workers in the EU. Workers in physically demanding occupations and workers engaged in manual work report a higher incidence of backache, muscular pains and physical exhaustion at the end of the day, while clerical workers, professionals and managers tend to report more instances of headaches, eyestrain, anxiety and sleeping problems. Services workers (e.g. hairdressers, waiters, guides) report an average incidence of all health problems (Figure 30).
Figure 30: Health problems, by occupation, EU-27 (%)
| Sector | 2010 | 2015 | 2024 | Difference 2010–24, ppts |
|---|---|---|---|---|
| All sectors | 45.2 | 45.8 | 46.4 | 1.2 |
| Agriculture | 38.2 | 34.9 | 30.5 | -7.6 |
| Industry | 28.9 | 28.8 | 29.7 | 0.8 |
| Construction | 8.6 | 9.2 | 10.6 | 2.0 |
| Commerce and hospitality | 50.8 | 50.6 | 50.2 | -0.6 |
| Transport | 22.7 | 22.4 | 22.5 | -0.1 |
| Financial services | 51.7 | 52.3 | 51.9 | 0.3 |
| Public administration | 45.7 | 46.3 | 49.6 | 3.9 |
| Health | 78.0 | 78.5 | 77.8 | -0.2 |
| Education | 71.3 | 71.8 | 72.5 | 1.2 |
| Other services | 51.7 | 50.7 | 49.3 | -2.4 |
Notes: The colour scheme in these heat maps illustrates how occupations compare to the EU average in reported health issues. Each column shows the percentage of workers in each occupation reporting health problems, with the EU average as a non-colour-coded reference. Red indicates significantly above-average reporting, orange represents moderately above or near-average levels, yellow reflects values close to the average, and green indicates below-average reporting.
Women are also more likely than men to report health issues, with the largest gender differences in self-reported health problems for headaches or eyestrain (54 % for women and 41 % for men) and anxiety (26 % for women and 16 % for men).
Information about health and safety at work and the prevention of work-related stress
A large majority of workers are well informed about occupational safety and health (OSH) risks and the prevention of work-related stress. However, there is a greater level of information about the OSH risks (41 % are very well informed) (Figure 31a) compared with the prevention of work-related stress (26 %) (Figure 31b).
Women are somewhat more likely than men to report being under-informed about both risks (with a gender gap of between 2 and 4 percentage points). There are also important differences by sector.
Workers are more aware of occupational health & safety risks than work-related stress prevention.
Impact of work on health
Work can only be sustainable if it does not impact negatively on workers’ health. The EWCS explores this aspect and workers are asked whether the effect of work on health is positive or negative. The proportion of workers reporting a negative effect on health decreased slightly from 26.7 % in 2010 to 25.5 % in 2024. The proportion of workers who believe their work has a positive effect on their health has increased compared with 2010, but remains comparable with the 2015 level (12 %). No effect at all was perceived by 63 % of respondents in 2024, the same as 2015, and down from 66 % in 2010.
A consistently high proportion of workers in lower-skilled occupations (33–35 %) (e.g. agricultural workers, craft workers, plant and machine operators, and those in elementary occupations) report a negative impact on their health as a result of their work. Transport (32 %), health (31 %), agriculture (30 %), construction (29 %) and industry (28 %) are sectors where larger shares of workers report that work affects their health negatively. Interestingly, health (16 %) and agriculture (15 %) are also sectors in which relatively more workers state that work affects their health positively (Figure 32).
Lower-skilled occupations have a much higher negative impact on workers' health.
Balancing work and private life


Key findings
Work–life balance has improved slowly but steadily for both men and women since 2010: in the EU-27, most workers report that their working hours fit very well (31 %) or well (52 %) with their family or social commitments outside of work.
The spillover of work into private life varies considerably across occupations. For example, skilled agricultural workers are most likely to worry about work in their free time (29 % reported doing so always or most of the time) while the proportion of plant and machine operators doing so is significantly lower (6 %).
The sector in which a person works also affects their work–life balance, with 16 % of workers in the health sector reporting that their job impacted negatively on the time they spent with their family.
Finding work–life balance
In the EU-27, the majority of workers report that their working hours fit very well (31 %) or well (52 %) with their family or social commitments outside of work. In contrast, 14 % say their working hours do not fit very well, while 3 % report that they do not fit at all.
Overall, men are slightly less likely than women to have a (very) good fit between their job(s) and private life (82 % versus 85 %), but this changes for both men and women over the life course. It is reported by fewer workers when there are children in their households (78 % of men and 82 % of women). Among occupations, clerical workers (89 %) and professionals (86 %) have the highest shares of workers who have a (very) good fit between their job(s) and private life, while agricultural workers (71 %) and services and sales workers (78 %) are least likely to have such a match (2). Employees have a better work–life balance than self-employed people – 84 % of employees reported having a (very) good fit compared with 75 % of self-employed individuals.
There has been a small improvement in work–life balance for both men and women since 2010. In 2010, 81 % of men reported that their working hours fit very well or well with their family or social commitments; this percentage remained stable in 2015 and increased to 82 % in 2024. The trend is similar for women, with 83 % reporting a (very) good match in 2010, compared with 84 % in 2015 and 85 % in 2024 (Figure 33).
Employees have a better work-life balance than self-employed people.
Sector and occupational differences in work–life conflicts
Working life and private life influence each other. Work–life conflict means that fulfilling demands in one area can make it difficult to meet obligations in the other. The EWCS captures the spillover of work into people's private lives by asking respondents how often over the 12 months prior to the survey they kept worrying about work when they were not working (‘worrying about work’); felt too tired after work to do some household jobs (‘tired after work’); and found that their job prevented them from giving the time they wanted to family (‘job affects family time’). There is considerable variation across occupations in the spillover of work into private life (Figure 34).
Skilled agricultural workers stand out as experiencing the highest levels of strain across two dimensions: 3 out of 10 (29 %) worry about work always or most of the time during their free time and 1 in 3 (36 %) are always or most of the time too tired after work. Similarly, 28 % of workers in elementary occupations and 27 % of craft workers also mention high levels of fatigue after work.
By contrast, the lowest levels of tiredness are found among clerical workers (16 %). Clerical workers also have the lowest share of workers who mention that their job always or most of the time affects their family time (9 %). At the other end of the spectrum are managers and services and sales workers: 15 % report that family time is affected by their job. Managers experience the second-highest levels of worrying about work (25 %), although their fatigue level after work remains below the average (19 %).
Agriculture workers worry about work and feel tired after work more than any other sector.
Among the economic sectors, agriculture stands out with the highest shares of workers who always or most of the time worry about work (27 %) and feel tired after work (34 %), and the third highest share of workers whose job affects their family time (15 %). The health sector has a high percentage of workers who feel tired after work (28 %) and whose job affects family time (16 %). The education sector has a significant share of workers who worry about work when not working (24 %).
Gender equality

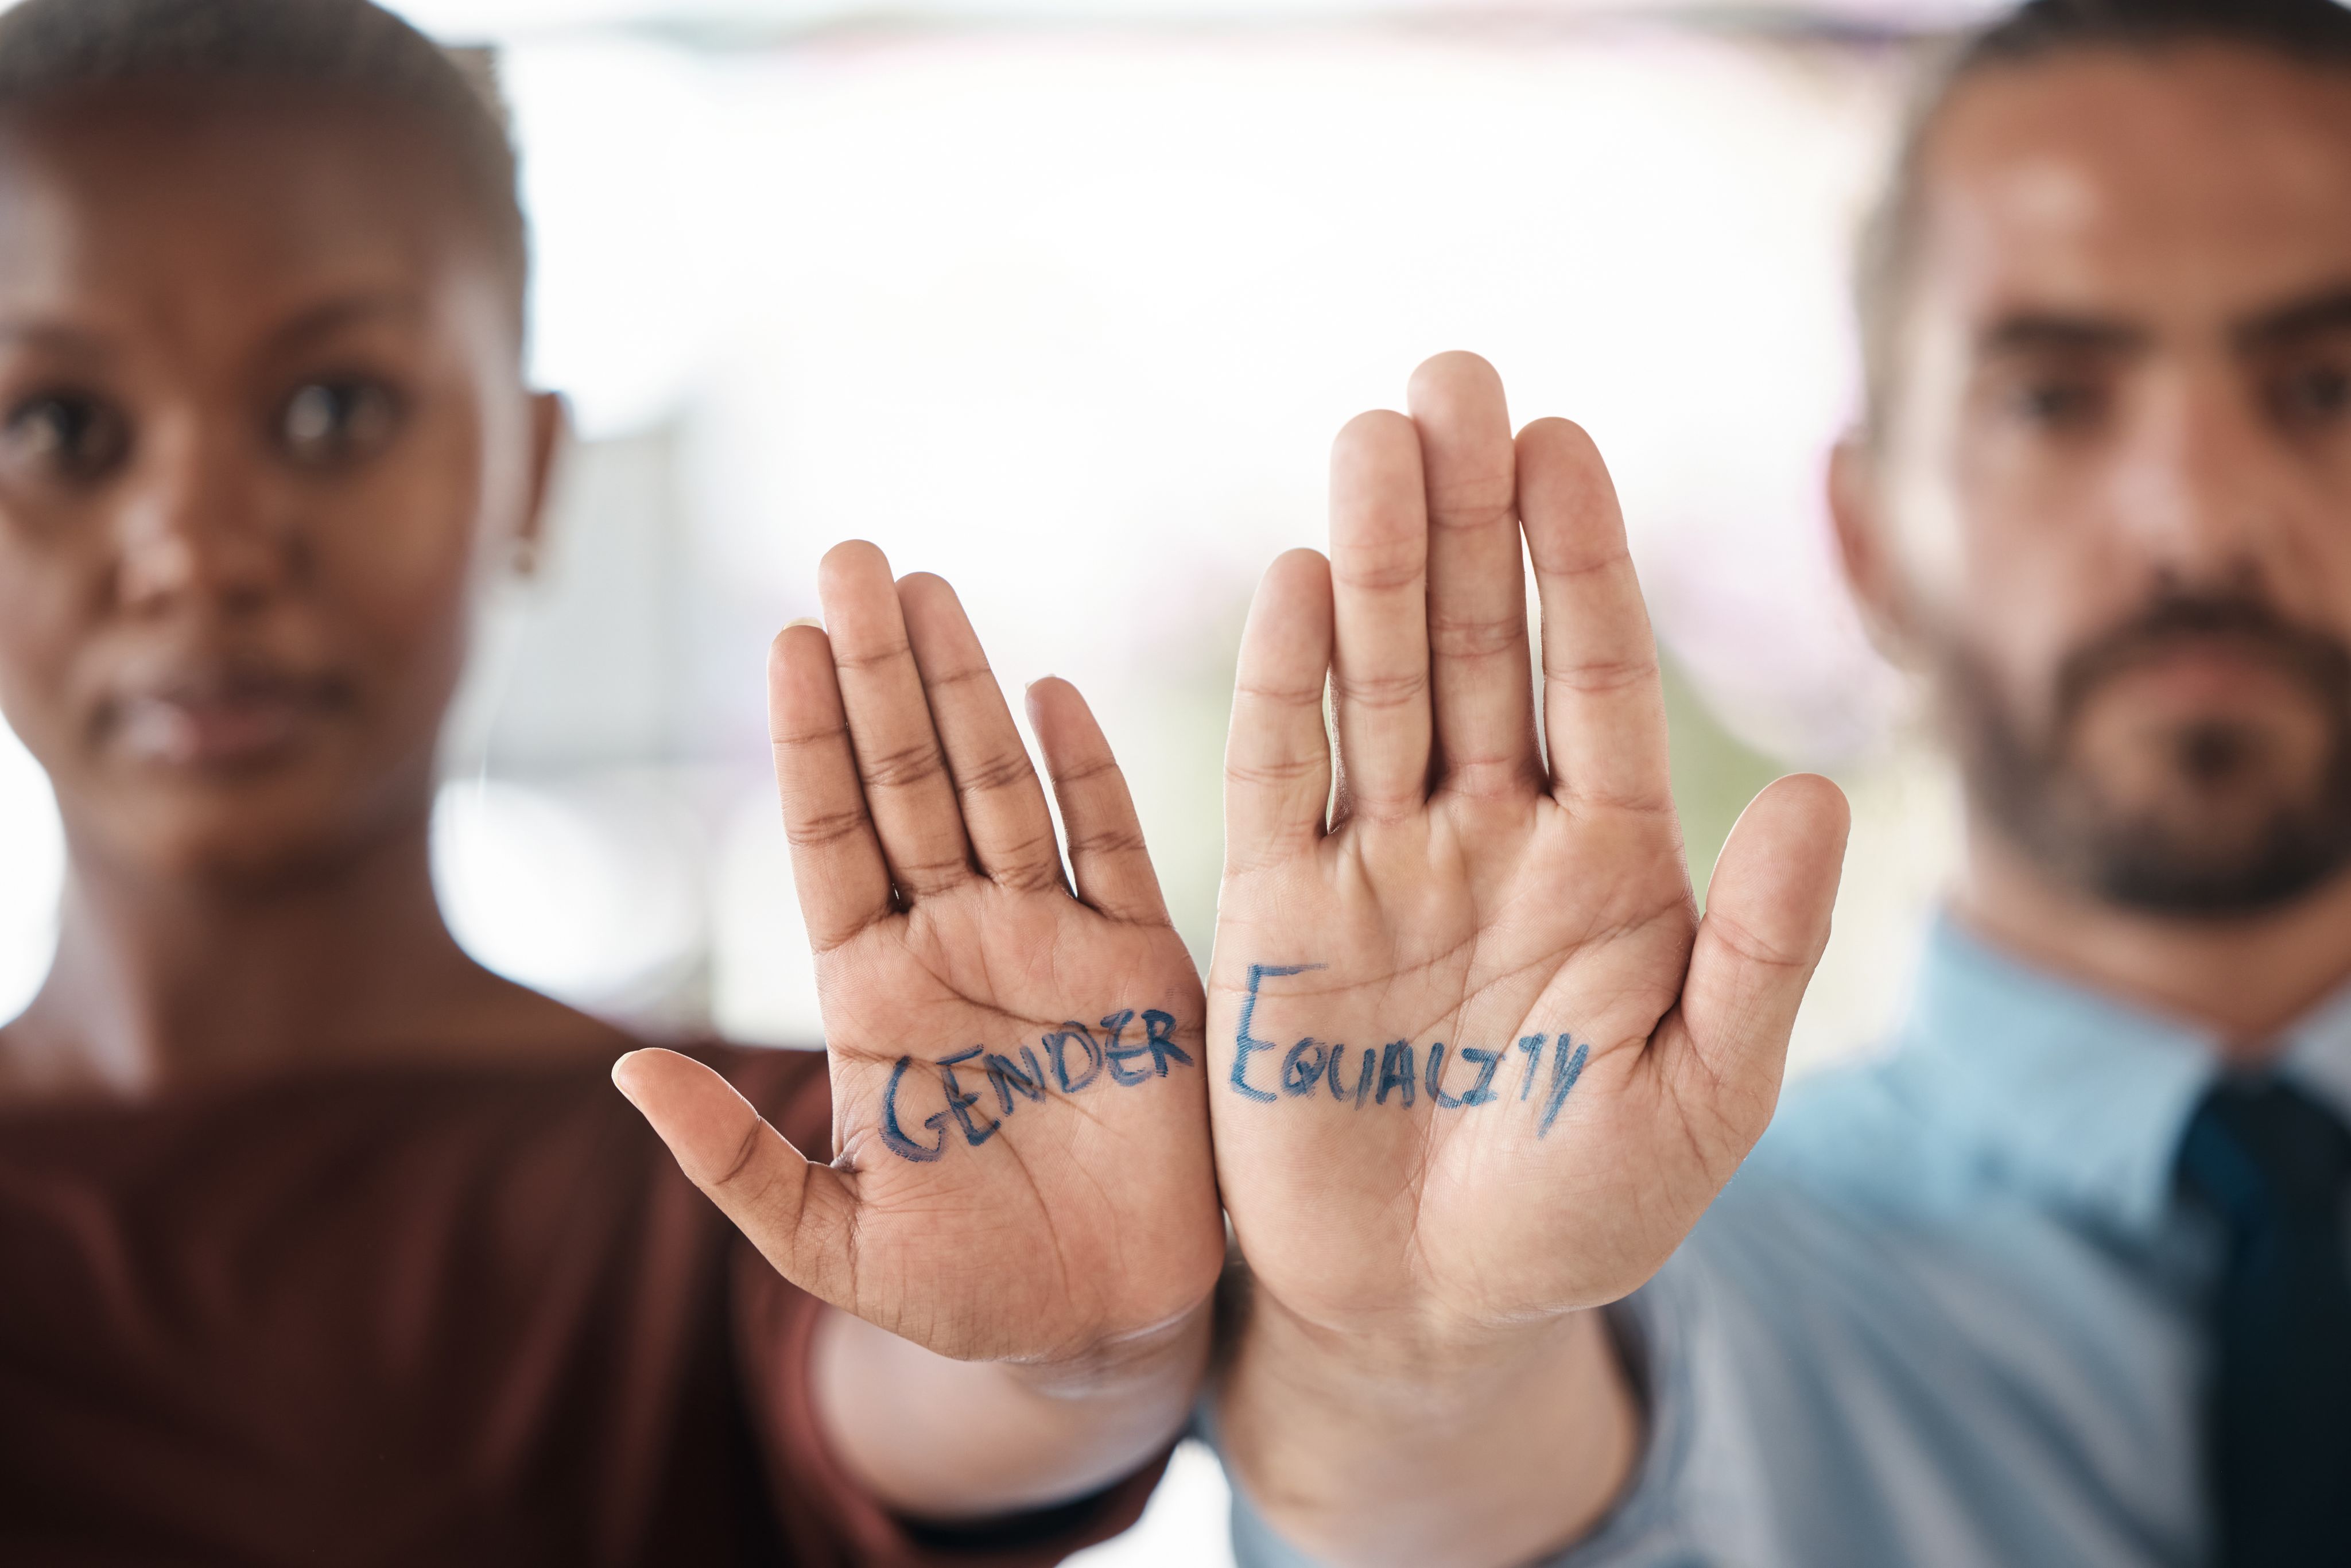
Key findings
A gender-balanced workplace remains the exception, with only 23 % of workers reporting that they work in workplaces where about half of the workforce is female.
Most sectors tend to be dominated by either men or women; employment is more or less equally shared from a gender perspective in only four sectors: commerce and hospitality, financial services, public administration and other services.
Almost two thirds of all new jobs created in the EU since 2000 have been occupied by women.
Very little progress has been made towards gender balance at management level over the past 25 years. While the proportion of female managers increased from 27 % in the 2000/2001 survey to 34 % in 2024, they continue to be concentrated in female-dominated workplaces.
Gender segregation at work
Around two out of every three net new jobs created in the EU this century have been occupied by women. Women accounted for 46.4 % of the EU-27 workforce in 2024 compared with 45.2 % in 2010. Some progress has therefore been made towards meeting the European Pillar of Social Rights Action Plan objective of halving the gender employment gap by 2030 (compared with the 2019 baseline).
Despite this, based on current trends, the target is unlikely to be met (Eurostat, 2025). Increasing female participation has contributed to a narrowing of gender gaps in some sectors and occupations, but not all. The context is one of persistent gender segregation of employment. This is not only true when looking at sectors and occupations, but also in the workplace. A gender-balanced workplace remains the exception, with only 23 % of workers reporting that they work in workplaces where about half of the workforce is female (Figure 35).
The sectoral picture is equally one of gender segregation. In only four sectors – commerce and hospitality, financial services, public administration and other services – has employment been, and remains, more or less equally shared between men and women. The remaining sectors tend to be dominated by either men or women and gender majorities were largely stable in the case of health and transport or growing in the case of education and agriculture between 2010 and 2024 (Table 8).
Table 8: Female employment share, by sector, EU-27, 2010–2024 (%)
Most employment sectors tend to be dominated by either men or women: less than a quarter of workplaces are gender balanced.
The female share of employment has been stable or declining in all broad occupational groups with the exception of the high-skilled categories: professionals and managers. In 2024, the majority of professionals in the EU-27 were women (53.7 %) (Table 9). As this was the largest occupation, and by some margin also the fastest growing, it has contributed to a more pronounced upgrading of female employment compared with male employment while also closing the headcount gap (Eurofound, 2025).
Table 9: Female employment share, by occupation, EU-27, 2010–24 (%)
Female managers
In the last 25 years, women have occupied 66% of new jobs; however, the proportion of female managers has only increased by 7 percentage points. The proportion of female managers increased from 27 % in the 2000/2001 survey to 34 % in 2024 (Figure 36). However, female managers continue to be concentrated in female-dominated workplaces, where gender composition of immediate bosses has reached parity. Women are hereby much more likely to have a female boss (52 %) than men are (18 %).
Men with higher levels of education are more likely to have female supervisors, with 25 % of highly educated men reporting this, compared with 15 % of those with a medium level of education and 12 % of those with a lower level of education.
No significant differences in the gender distribution of supervisors are observed among women across education levels. The presence of a female boss is strongly associated with the gender composition of the workplace. Only 5 % of employees in workplaces with (nearly) no female workers report having a female supervisor. In contrast, this share increases to 30 % in gender-balanced workplaces and rises further to 76 % in environments where (nearly) all employees are female. This reflects a labour market that remains heavily segregated by gender.
Engagement and motivation


Key findings
The data show a slight decline in workers’ engagement (as measured by the levels of energy, enthusiasm and absorption they feel in relation to their job) when compared with the 2015 survey results.
The proportion of workers carrying out monotonous work has increased over the years, rising from 39 % in 1995 to 48 % in 2024.
Variations are apparent at country level with regard to workers feeling motivated by the organisation they work for: 80 % of workers in Ireland are motivated by their organisation to do good work. Similar proportions apply for Denmark (79 %), the Netherlands and Austria (both 78 %), while Czechia, Greece and Cyprus all report proportions below 50 %.
Engagement and creativity
At an individual level, work engagement is positively related to job performance, creativity and health and well-being; it prevents frustration with work and absenteeism. At a collective level, work engagement contributes to greater commitment to the organisation, client/user satisfaction and – as a consequence – higher employee retention. When compared with the EWCS 2015 results, the 2024 data indicate the same proportion of workers reporting enthusiasm (‘you are enthusiastic about your job’) but fewer reporting energy (‘you feel full of energy at work’) and absorption (‘time flies when you are working’) (Figure 37).
This reduction in terms of engagement is reflected in a similar pattern in terms of creativity. As discussed in the section on skills and discretion, the share of workers stating that they can apply their own ideas at work always or most of the time has been declining since 2005 and has affected male and female workers. In a similar vein, the proportion of workers carrying out monotonous work has increased by 8 percentage points since it was first captured: from 39 % in 1995 to 48 % in 2024 (Figure 38).
More people are carrying out monotonous tasks and fewer feel like they can apply their own ideas at work.
Motivation
The role of organisations in motivating workers is an important aspect of work engagement. The highest proportions of workers who strongly agree or tend to agree with the statement that the organisation they work for motivates them to do good work were reported in Ireland (80 %), Denmark (79 %), the Netherlands and Austria (both 78 %), while Czechia, Greece and Cyprus all report proportions below 50 %. With 35 % of workers tending to disagree or strongly disagreeing with the statement, Cyprus had by far the biggest proportion of negative assessments (Figure 39).
Across the sociodemographic groups, men are observed to be more likely to be motivated by the organisation (70 %) than women (66 %) as are younger (aged 16–29) and post-retirement age workers (aged 65+) compared with prime age and older workers. Education is a factor in motivation: workers with a tertiary degree are more likely to be motivated (73 %) than those with medium (67 %) or low levels of formal education (65 %).
What workers want


Key findings
Most workers (56 %) are happy with their working hours.
It’s not all about the money: workers most value a safe working environment for mental and physical health (71%); a trusting working environment (69%); and good pay and benefits (66%).
Doing work that is good for the natural environment comes at the bottom of the list, being considered very important by fewer than 50 % of respondents.
For self-employed people, being able to use their own initiative at work is the most important aspect of work for them, with 74 % of all self-employed people ranking it in first place.
Gender and age play a role in what matters most to workers: men between the ages of 16 and 54 value good pay and benefits most, while a safe working environment for mental and physical health is the most important aspect for women aged between 16 and 64.
In the EU-27, almost 1 in 5 respondents aged 45 or over would like to work ‘as long as possible’ while 1 in 10 responded they would like to retire ‘as early as possible’.
Working time preferences
In 2024, most workers (56 %) were happy with their working hours. However, an important share would prefer to work fewer hours than they were at the time of the survey, provided that they could make a free choice regarding working hours and taking into account the need to earn a living: 35 % of male workers and 31 % of female workers fell into this category. An additional 11 % would prefer to work more hours than they were at the time of the survey.
A preference to work fewer hours is more likely to be reported by men aged between 30 and 54 (38 %), while a preference for longer hours is expressed by relatively more young men and women: 20 % of women and men aged 16 to 24 would like to work more hours. This compares with only 10 % of women and 5 % of men aged between 55 and 64.
There are considerable differences across countries when it comes to working time preferences and substantial gender differences in some countries. For instance, the share of workers preferring to work fewer hours is larger for women than for men in Cyprus, Finland, Lithuania and Sweden, whereas the opposite is the case in Austria, Ireland, Italy, Luxembourg and Spain. The shares of those preferring to work longer hours are larger among both men and women in France, Malta and the Netherlands and among women in Germany (and Switzerland).
Unsurprisingly, those who work very long hours are more likely to say they would prefer to work less: the share of those who would prefer to work fewer hours nearly doubles to close to 70 % of those working 41 hours or more per week. At the same time, the share of workers who want to work more hours per week quadruples to 41 % among those whose usual working week is 20 hours or less per week (Figure 40).
Aspects of work that matter most
Thinking about work in general, respondents to the EWCS 2024 were asked to say how important several work-related aspects are to them. Figure 41 ranks such aspects from the most important to the least important, being indicative of workers’ preferences regarding the aspects asked about. A safe working environment for mental and physical health and a trusting working environment are the most important aspects for the largest shares of workers in the EU: 71 % and 69 %, respectively. Good pay and benefits come in third, being considered as very important by two thirds of respondents.
Being able to learn and develop new skills, to use one’s own initiative at work and to do work that is good for the natural environment appear at the bottom of the list, being considered as very important by half of workers or fewer. Remarkably, the top aspect for the self-employed is being able to use one’s own initiative at work (reported as very important by 74 % of all self-employed people), and is only then followed by a safe (73 %) and trusting working environment (69 %).
Self-employed people value being able to use their own initiative at work significantly more than employees do (74% vs 48% 'very important').
It is noteworthy that the order of importance given by men and women regarding these work-related aspects is different and seems to change over the life course. In general, a safe working environment for mental and physical health is the most important aspect for men and women. However, while good pay and employee benefits come second for men, women prioritise a trusting working environment.
Good pay and benefits rank only in 6th place for women, after good working hours, a manageable workload and meaningful work. Good pay and benefits are the most important aspect for men up to the age of 54, whereas a safe working environment for mental and physical health is the most important aspect for women of all age groups, except for those aged 65+ (for whom a trusting working environment is the most important).
A trusting working environment increases in importance with age and becomes the second most important aspect for men aged 55 or more, for whom a safe working environment for mental and physical health is the most important aspect (Figure 42).
Retirement preferences


Respondents aged 45 years or older were asked to state their preferred age for retiring from work: ‘Thinking about retirement, until what age do you want to work?’ Some 63 % of workers mentioned a specific age, while 37 % spontaneously responded differently. A substantial proportion expressed a desire to continue working indefinitely, with around 1 in 5 (19 %) stating they would work ‘as long as possible’.
In contrast, approximately 1 in 10 respondents in this age group (11 %) indicated a preference for earlier retirement, stating they would retire ‘as early as possible’. For those who specified a concrete retirement age, the average desired retirement age was 63.8 years for men and 63.1 years for women in the EU-27.
The desired retirement age (if mentioned explicitly) exhibits significant variation across countries (Figure 43). Notably, Albania (66.3 years) and the Scandinavian countries (Denmark, Norway and Sweden, all close to 66 years), report the highest desired retirement ages. In contrast, Slovenia (60.3 years), Luxembourg (60.7 years) and Poland (61.1 years) have the lowest desired retirement ages.
Furthermore, the survey reveals interesting patterns in workers’ attitudes to retirement. Respondents who spontaneously answered the question rather than naming a specific age, were categorised into ‘want to work as long as possible’, ‘want to stop working as early as possible’ or ‘don’t know’. Estonia (22 %), Hungary (18 %) and Montenegro (17 %) have the highest proportions of respondents who said they wanted to work for as long as possible. Conversely, Portugal (13 %), Italy (12 %), Greece and Latvia (both 9 %) have the highest proportions of respondents who would prefer to retire as early as possible.
More people want to work 'as long as possible' (19 %) than to retire early (11 %).
Employee representation


Key findings
While the majority of employees in the EU have access to some form of collective representation (80 %), a significant minority do not have formal representation or meetings in the workplace.
There are clear disparities at sectoral level when it comes to employee representation: 56 % of workers in agriculture do not have collective representation or meetings to express their views, while the share is much smaller in public administration, education and financial services (11 % or less).
Based on the answers received, employees can be classified into the groups represented in Figure 44. The vast majority of employees in the EU have access to some sort of collective form of representation or at least to meetings where they can express their views about what is happening in the organisation. However, it is noteworthy that, in 2024, 21 % of employees did not have formal representation or meetings in the workplace and an additional 10 % reported the existence of meetings where they can express their views but have no collective representation.
Figure 44: Access to employee collective representation and meetings to express views, EU-27 (%)
The share of employees who do not have collective representation or meetings to express their views is much smaller in public administration, education and financial services (11 % or less) than in construction (29 %), commerce and hospitality (36 %) or agriculture (56 %). This share diminishes with workplace size and is very small (3 %) in workplaces with 250 workers or more.
The share of employees without collective representation or meetings is larger in Portugal (close to half) and Albania (45 %), Bulgaria and Hungary (both around 40 %), and comparatively smaller in Germany and the Nordic countries.
Conclusions
The changes in the world of work brought about by digitalisation add to the need for a detailed analysis of the situation of different groups of workers. With around 20 % of workers engaged in some form of telework, the EWCS 2024 provides evidence that such workers are at a higher risk of blurred boundaries between their work and private life. The impact of technology use, including the use of AI and algorithmic management, requires further investigation.
The EWCS 2024 shows that workers experience both the removal and creation of tasks as a result of technology use. The use of algorithmic management for allocating work tasks, monitoring performance and determining when work is done is still rather limited. However, in some sectors, such as financial services, even in 2024 around one third of workers reported that computer programmes allocate their work tasks and monitor their performance.
The EU is committed to improving job quality further. The European Commission is currently working with the social partners and the Member States on a flagship initiative, the Quality Jobs Roadmap, with the aim of promoting quality jobs in the EU. Quality jobs are recognised as a key factor in enabling and supporting competitiveness, fostering social fairness and contributing to just transitions. Quality jobs must also fulfil workers’ expectations of work.
The EWCS 2024 shows that even though good pay and employee benefits rank highest for a large share of workers, a safe working environment for mental and physical health is most frequently mentioned as very important, followed by the importance of a trusting working environment.
Ask the experts

Barbara Gerstenberger
Barbara Gerstenberger is Head of the Working Life unit at Eurofound. In this role, she coordinates the research teams investigating job quality in Europe based on the European Working Conditions Survey.
Agnès Parent-Thirion
Agnès Parent-Thirion is a senior research manager in the Working Life unit, tasked with the planning, development and implementation of working conditions research projects, in particular the European Working Conditions Survey and its analyses.

Jorge Cabrita
Jorge Cabrita is a senior research manager in the Working Life unit. He is responsible for formulating, coordinating and managing European-wide research, and promoting the dissemination of findings in the areas of working conditions and industrial relations.

Franz Ferdinand Eiffe
Franz Eiffe is a research manager in the Working Life unit at Eurofound. He is involved in projects on sustainable work, quantitative analyses and upward convergence in the EU.

Sara Riso
Sara Riso is a senior research manager in the Working Life unit. She is engaged in projects focusing on digitalisation and working conditions, exploring new workplace stressors arising from increased digitalisation, evolving organisational practices, and change management strategies.

Karel Fric
Karel Fric is a research officer in the Social Policies unit. His work involves survey research, data analysis and project management, with a particular focus on working and living conditions, equality and discrimination.
John Hurley
John Hurley is a senior research manager in the Employment unit. His main research interests are in the areas of comparative labour market analysis, restructuring and the changing world of work.

Christopher White
Chris White is a survey data officer, based in the Employment unit. He is tasked with providing support for all three of Eurofound's surveys: the EWCS, EQLS and ECS.