
European Working Conditions Survey 2024
Highlights




Insights into a new world of work
The European Working Conditions Survey 2024 (EWCS 2024) provides a comprehensive overview of job quality in Europe, examining the characteristics of the workforce, workplaces, job quality and the quality of working life. The EWCS 2024 is a crucial tool for policymakers, as it provides a unique insight into the state of work in Europe and highlights the importance of job quality in achieving sustainable and inclusive growth. The survey’s findings are based on:
36,644 face-to-face interviews in 35 countries
The objectives of the survey are to:
- measure working conditions across European countries on a harmonised basis;
- analyse relationships between different aspects of working conditions;
- identify groups at risk and any issues of concern and areas of progress;
- monitor trends over time;
- contribute to the development of European policy on quality of work and employment issues.
See the highlights below from each chapter.
Key messages
Digital technologies and climate change are transforming jobs and how work is organised. Their impact on working conditions is reshaping Europe’s labour market in multiple ways.
Better job quality benefits both workers and companies. It is linked to better health and well-being, higher motivation and stronger levels of engagement, and is essential to support competitiveness.
Despite overall improvements in job quality, the benefits are not shared evenly. Significant gaps persist in terms of gender, age, place of origin, health status, occupation and sector.
Men report higher job quality than women across five of the seven job quality dimensions. In some areas the gap is widening – work intensity is worsening for women while improving for men – highlighting the need for targeted policy attention.
Older workers, women, workers with chronic health problems and migrant workers account for an increasingly large share of the workforce. Faced with an ageing and shrinking workforce, good quality jobs will be critical in Europe to attract and retain a larger share of a more diverse population in work for longer.
Chapter 1
Workforce

Summary
The EU workforce continues to grow despite demographic challenges. The increasing participation of women and older workers has contributed to the growth in employment. Migrant labour has also boosted employment, as has the higher average skill level of the workforce.
With traditionally male-employing sectors such as construction, agriculture and industry reducing in size and many female-majority service sectors expanding, the gender employment gap has narrowed. However, gender occupational segregation still exists. Only one in four workers (23%) in the EU work in a gender-balanced workplace.
Over the past quarter-century, there has been limited progress towards gender balance at management level. Nearly two-thirds of EU workers have a male boss. Female managers are most common in female-dominated workplaces.
The share of workers living in households with children has stayed relatively stable at around 32%.
Some 80% of the workforce are in good or very good health, while 2.5% are in bad or very bad health. In terms of well-being, men at work have a higher score on the World Health Organization's WHO-5 Well-being Index (71) than women (68).
Around 12% of EU workers have a chronic illness that limits their ability to do normal activities. In addition, 5% said that, while not having a chronic illness, they had a health problem limiting their ability.
Nearly three quarters of the EU workforce work in service sectors. Professionals accounted for the largest and fastest-growing occupational group. The share of part-time workers has been stable, while the shares of those in temporary employment and self-employment have declined.
45%
Since 2010, around 45% of net new employment in the EU has been among foreign nationals.
2.9
In 2024, the average worker's household in the EU consisted of 2.9 people.
66%
Two-thirds of EU employees have a male boss, but this share varies significantly between countries.
39%
In 2024, 39% of all EU workers had completed tertiary education, compared with 28% in 2010.
5%
Around 5% of workers in the EU have more than one job, down from 8% in 2015; 22% of this cohort do so to make ends meet.









Reasons to be cheerful
The level of subjective well-being in the EU (as measured by the WHO-5 Well-being Index) remains quite high and has increased by 0.5 percentage points since 2015. The average EU score was 69 in 2024 (71 for men and 68 for women). With very few exceptions, the score for men across countries is very close to or higher than that of women.
Scores on the WHO-5 Well-being Index by country and gender
Younger and post-retirement-age workers have the highest scores, while prime-age and pre-retirement-age workers have the lowest scores. This U-shape of subjective well-being scores by age categories is observed for both men and women.


‘The main contributing factors on the supply side to the growth in employment have been increased female participation (and the concomitant growth in the share of dual-working-parent households), a much greater likelihood that older adults (55+ years) will be in employment, increased immigration and the increased educational attainment levels of the workforce.’
Chapter 2
Workplace practices


Summary


Technology
While women report a higher frequency of computer use, men are more likely to use emerging technologies like generative AI tools. The higher frequency of computer use among women is mainly related to the nature of occupations in which women are over-represented, such as clerical work. Older workers and those with lower levels of education are less likely to use such tools.
EWCS data show that technology is more likely to create new tasks than remove existing tasks. Workers are also more likely to report that technology facilitates increased interaction among colleagues.

Location
Combining different work locations is common among workers in the EU. Only 4 in 10 workers in the EU carry out work exclusively from one location. Almost 3 out of 10 employees telework from home, on a full-time, regular or occasional basis.
Half of workers who work at least sometimes from home do not have a dedicated room (alone or shared) in which to work.

Teamwork
Working in teams is widespread in the EU. In 2024, almost 6 in 10 workers (59%) reported working in teams that share common tasks and can plan their work, with men and women participating in teams to similar extents.
Employees in autonomous teams tend to exhibit a greater propensity for learning and development and for applying their own ideas. Teamwork also fosters a supportive work environment. Among the drawbacks are higher exposure to longer working days (especially among those working in multiple teams) and a higher work intensity in terms of pace determinants.


Health
Some 17% of employees with somewhat limiting conditions as a result of long-standing health issues and 23% of those with severely limiting conditions report that they need workplace accommodation but do not have it, whereas between 34% and 36% in each group report receiving accommodation, but only partially.
Nearly half of respondents report that their employers do not provide accommodation for women’s disruptive health issues (painful periods and menopause), while a large share of respondents (more than one third) report that they do not know whether or not their employers provide such accommodation. Full accommodation and partial accommodation by employers were reported by 20% and 15% of respondents, respectively.

Representation
In 2024, one fifth of employees in the EU (21%) had neither formal representation nor meetings at the workplace at which they could express their views. Another 11% report the existence of such meetings but no collective representation in their companies or organisations. 36% of employees say that both collective representation and meetings at which they can express their views exist in their workplace.
The share of workers with trade union, works council or similar employee representation at the workplace is above 80% in Norway and Sweden, but is only around 25% in Albania, Bulgaria and Estonia.
Some 85% of employees in large workplaces (over 250 employees) report the existence of a trade union, a works council or similar employee representation, compared with 25% in micro-workplaces (1–9 employees).
Interactive service workers – backbone of the economy
44%
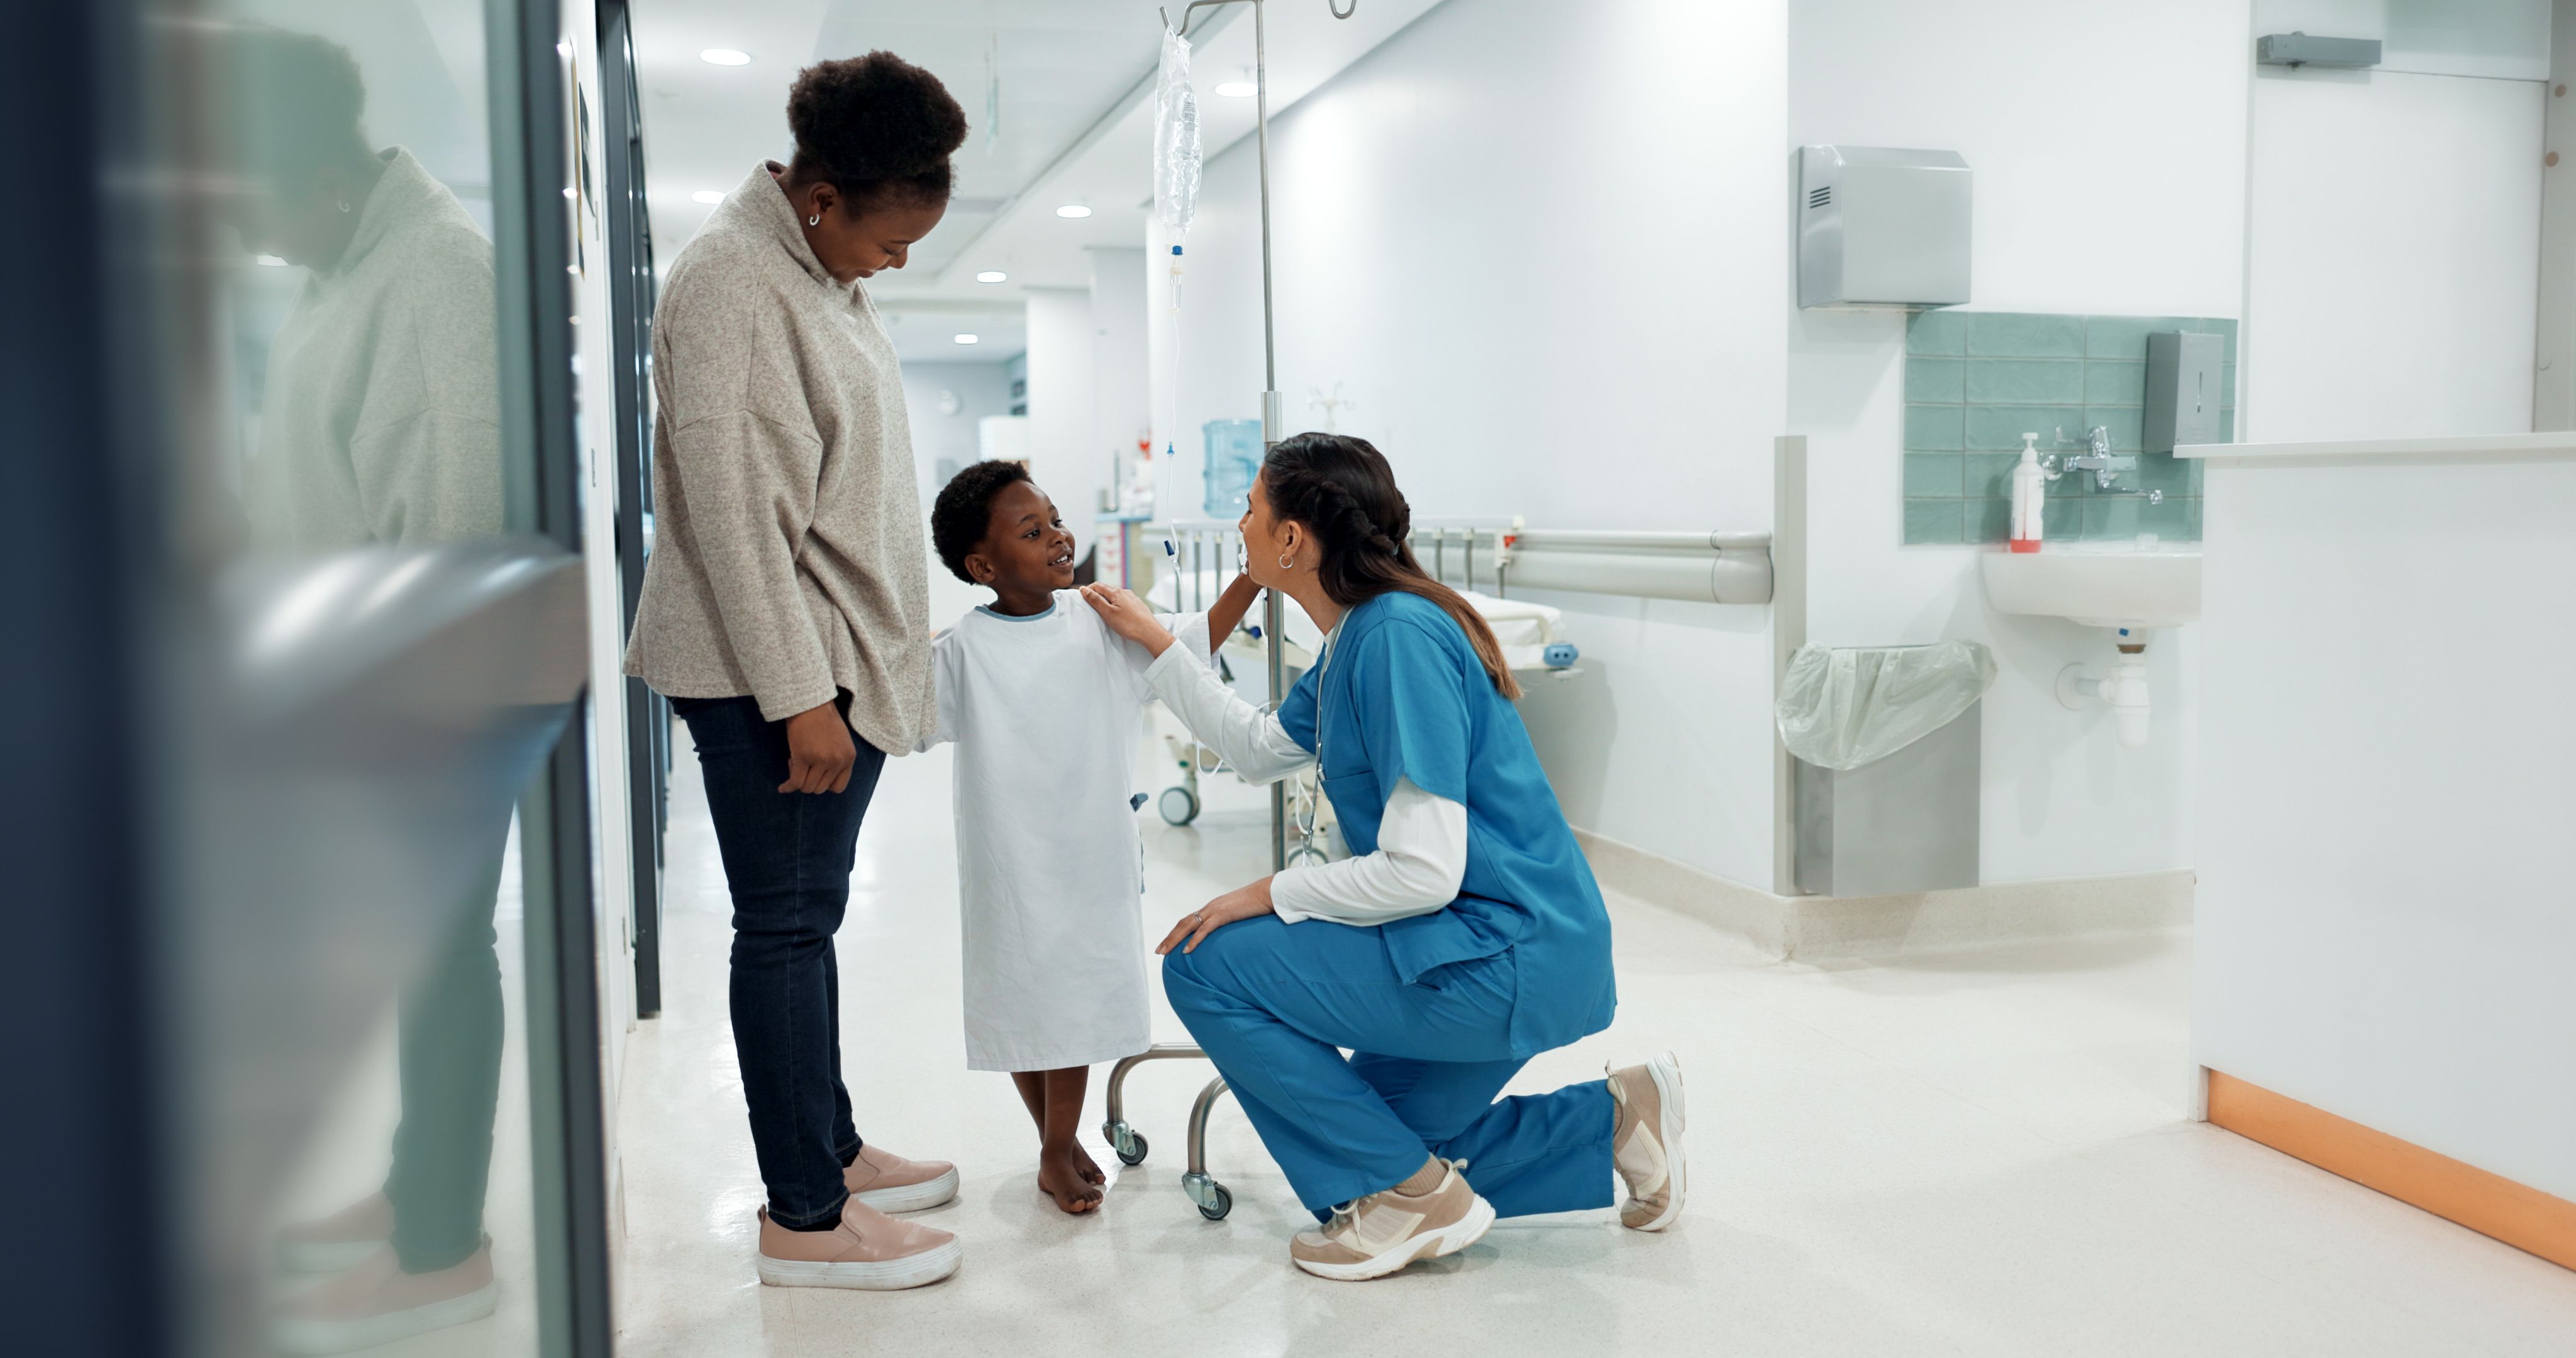
A large share of workers in the EU (44%) are in jobs dealing directly with service recipients (all or almost all of the time), such as clients, customers, patients and pupils. Most of these ‘interactive service workers’ (57%) are women.
How autonomous are teams working in the EU?
64%
Members of the team decide on the division of tasks in two thirds (64%) of cases. There are substantial country differences, the figure being 75% or more in Austria, Finland and Sweden. By occupation, this freedom to decide is greatest for skilled agricultural workers (75%) and professionals (72%). By sector, it is greatest in agriculture (77%) and education (73%); it is lowest in transport (56%).
49%
Team members can choose the timetable of the work in 49% of cases; more than 60% of the workforce involved in teamwork can decide on the timetable in Austria, Denmark, Hungary, the Netherlands and Poland.
27%
Team members choose the head of the team in 27% of cases – 37% or more in Austria, Ireland, Finland, Slovenia and Sweden. Differences in terms of occupation and sector are noticeable, ranging across occupations from 17% (elementary occupations) to 37% (skilled agricultural workers) and across sectors from 23% (commerce and hospitality) to 34% (agriculture).
Adapting workplace to workers’ health situations
38%
About one third of respondents (38%) with health problems stated that their employers fully accommodate their health issues.
28%
28% of respondents with health problems stated that they do not get or need such accommodation from employers.
24%
Some 24% of those with health issues stated that accommodation of these issues by employers is made but is only partial.
Health and safety a matter of employee representation
6 in 10
Employee representation also includes the health and safety of workers. Overall, in 2024, about 6 in every 10 employees in the EU reported the existence of a health and safety delegate or committee in their company or organisation (59% in 2015) while about 8% do not know if such a role or body exists (6% in 2015). The prevalence of this type of representation increases with the workplace size.




Significant share of employees lack representation and voice
Overall, 53% of EU employees report having a representative body in their company or organisation (an increase from 48% in 2015), while another 5% report that they do not know if such representation exists (4% in 2015).
Latvia, Bulgaria and Estonia are the Member States with the greatest deficit of this kind of collective representation, with less than one third of employees reporting this in all three Member States.
In France, Belgium, Finland, Denmark and Luxembourg, two thirds or more of employees report a trade union or works council at the workplace. Sweden is the Member State with the largest share (80%), but Norway has the largest share of all (82%).
‘Research has established that the presence of employee representation at the workplace can be a determining factor in creating and improving working conditions.’
Chapter 3
Measuring job quality

Summary
Job quality is measured at the level of the job. It is captured using seven job quality indices. These indices are positively associated with health and well-being, confirming their validity. They are empirically associated with engagement, motivation, trust and cooperation, work–life balance and financial sustainability, confirming the significance of job quality. Research highlights the positive role that job quality plays in quality of life, political participation and trust in democracy.

Earnings

Working time quality

Prospects

Skills and discretion

Work intensity

Social environment

Physical environment

Job quality of different workers
On average, in the EU, men report higher job quality than women in all job quality dimensions with the exception of Working time quality and Physical environment.
Younger workers (under 30 years) score lower than older workers (30–64 years) on most job quality indices except Social environment, raising concerns about their future labour market participation.
The Prospects and Skills and discretion index scores of first-generation foreign-born workers are significantly lower than those of second-generation and native workers.
Job quality is lowest in very female-dominated occupations in all dimensions except Work intensity and Physical environment.

Occupations and sectors
There are important differences between occupations: managers, professionals and technicians have higher scores, on average, in the Earnings, Prospects, Skills and discretion, and Physical environment indices than workers in other occupations.
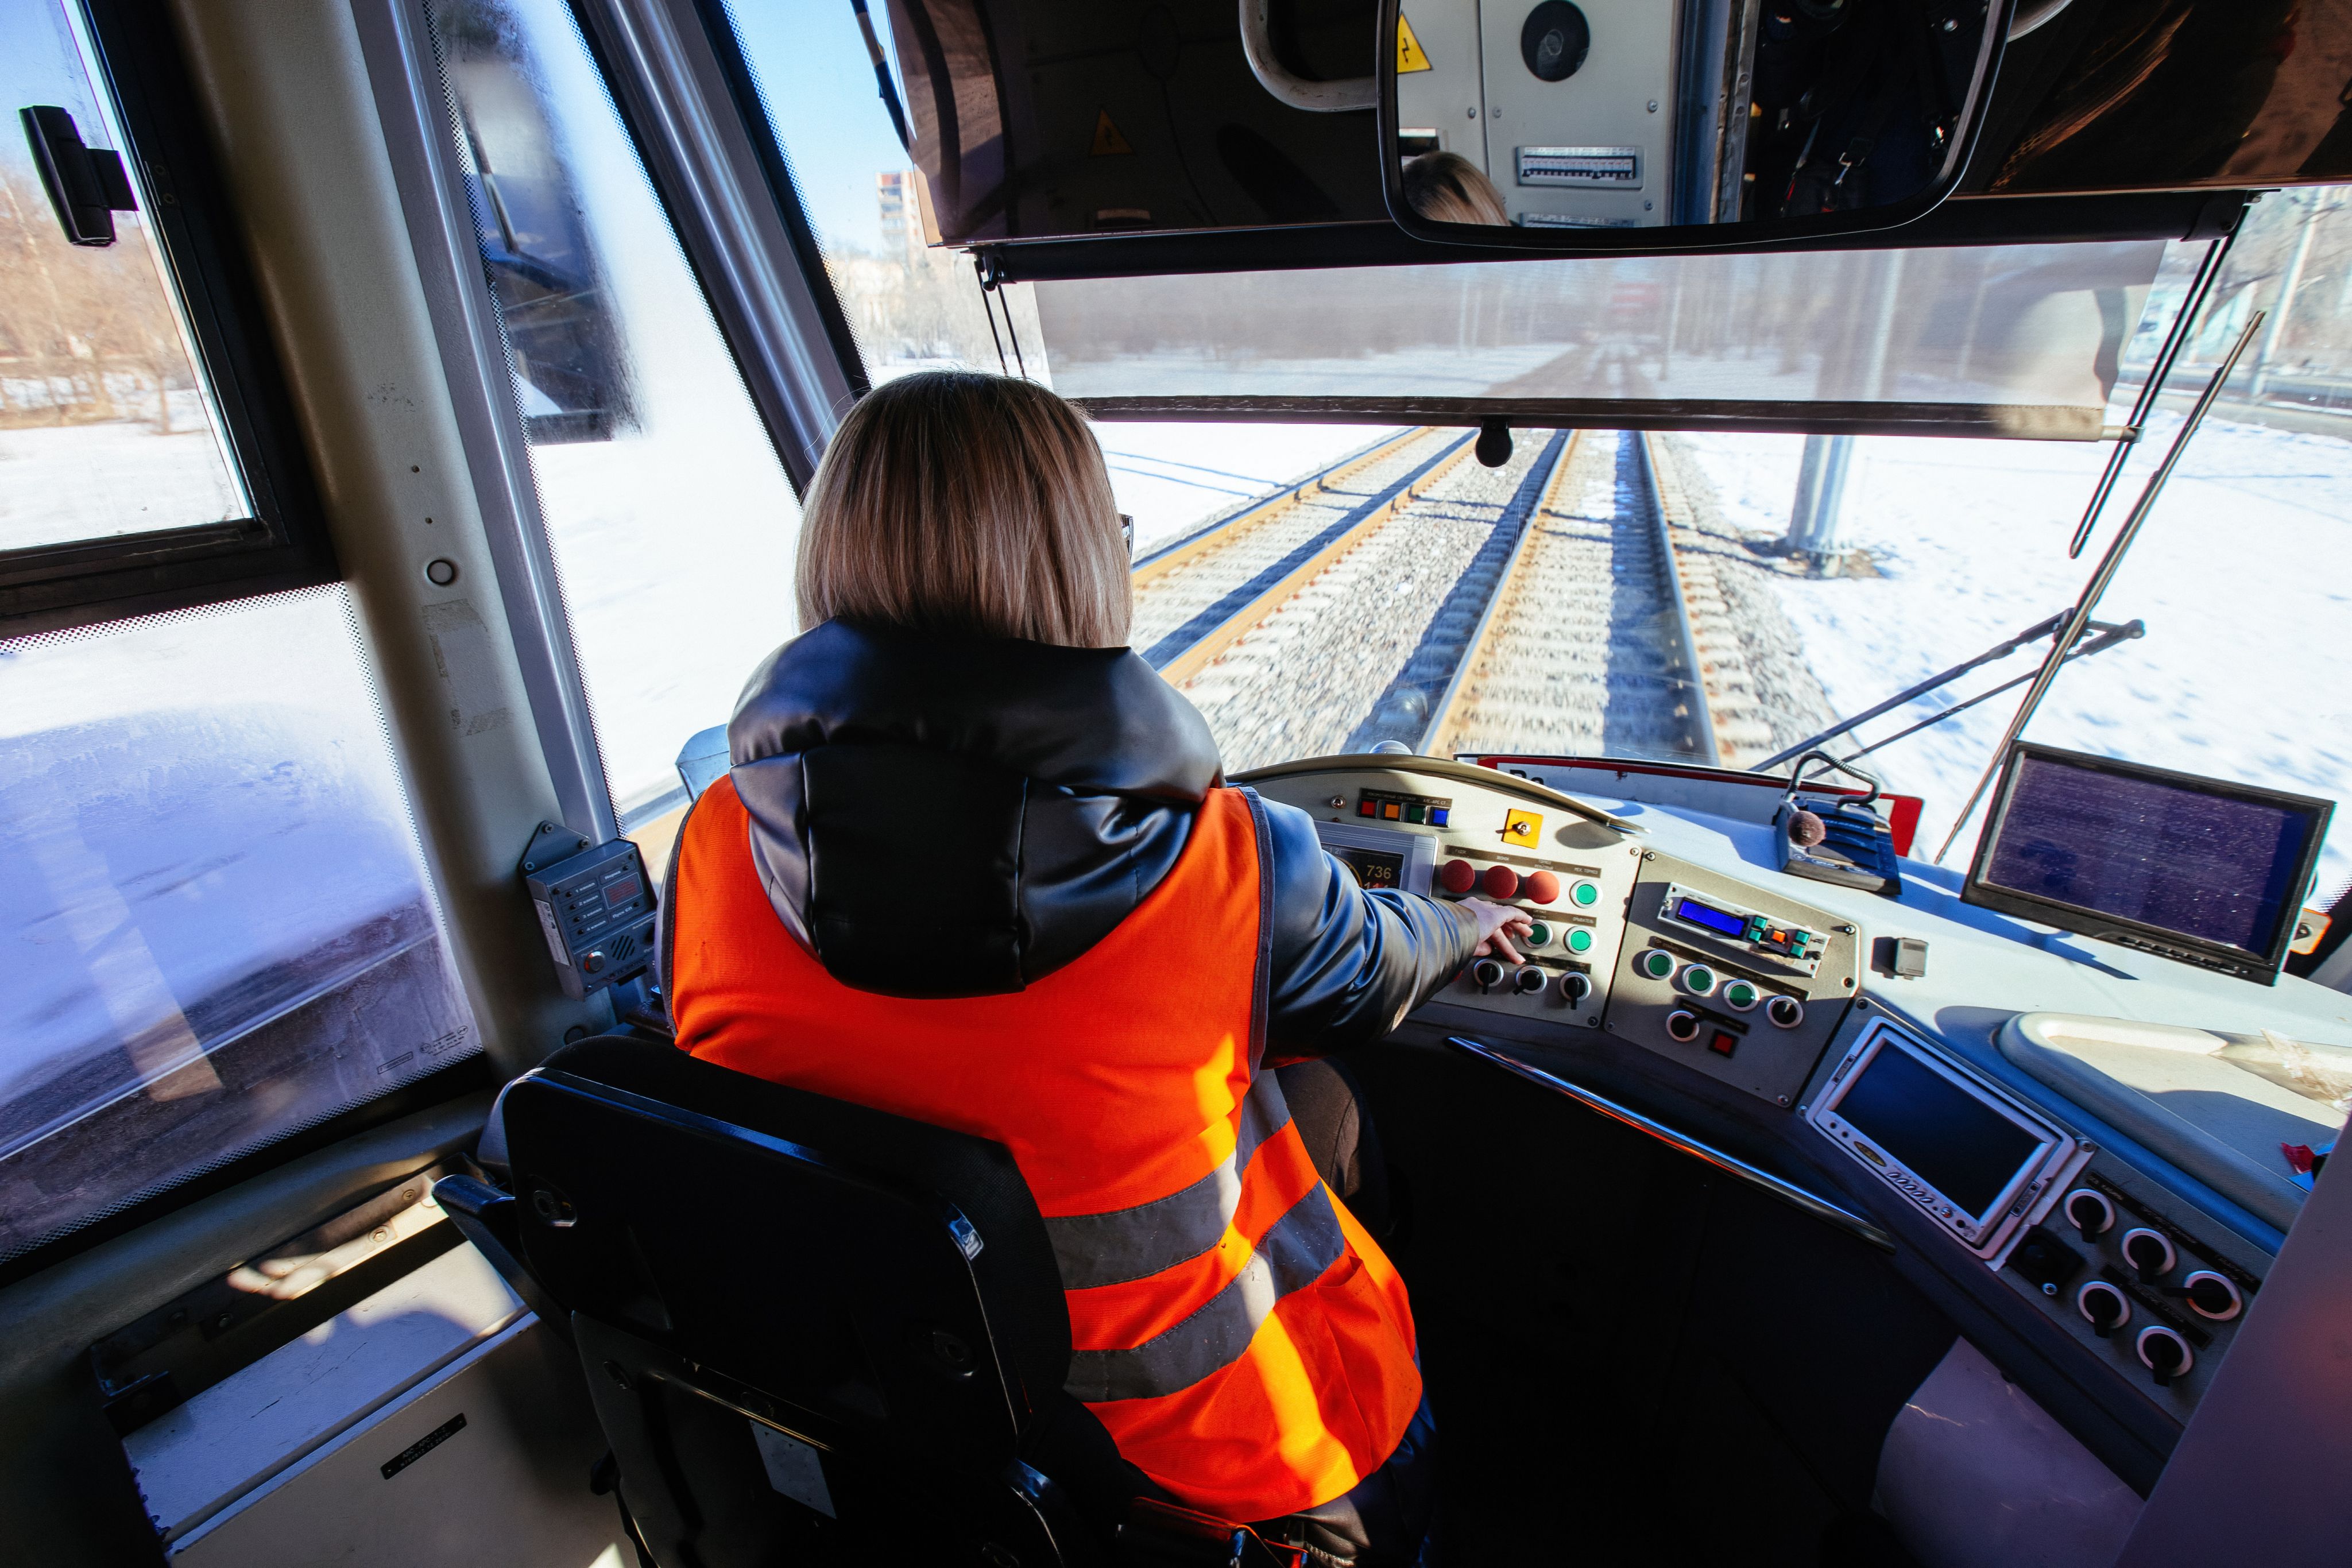
There are also significant differences in job quality between sectors. Workers in the transport sector experience the poorest job quality in four dimensions: Prospects, Working time quality, Skills and discretion, and Social environment.
Workers in occupations with labour shortages experience modest wage advantages but score persistently poorer on non-wage aspects of job quality, particularly those related to Working time, Work intensity, Skills and discretion, and Physical environment. To develop the attractiveness of these occupations (which include doctors, nurses, cooks and various trades workers), efforts should be made to improve the quality of the work in these occupations.

Country differences
There are significant differences in job quality between countries, which reflect different workforce compositions, institutional frameworks and regulations. The job quality gaps between Member States are particularly significant in relation to Skills and discretion, but also to Work intensity and Prospects.
Job quality by gender
On average, men report higher job quality than women in all job quality dimensions with the exception of Working time quality and Physical environment. Differences between men and women are largest in Earnings and Physical environment.
Job quality by age
When compared with core-age workers (30–64 years ), younger workers (under 30 years) have lower scores on most of the job quality indices, except Social environment. The poorer quality of their professional integration raises concerns over their future labour market participation.
Job quality by origin
Some 45% of the net new employment in the EU since 2010 has been among foreign nationals. First-generation foreign-born workers score significantly lower with regard to Prospects and Skills and discretion than second-generation and native workers. The scores on the Earnings index of first- and second-generation immigrants are significantly lower than those of native workers. Social environment, Physical environment and Working time quality scores are lowest for first-generation immigrants but Work intensity is highest.
Job quality by occupation
In terms of occupation, there is a clear job quality gradient. Managers, followed by professionals and technicians, experience, on average, higher scores on the Earnings, Prospects, Skills and discretion, and Physical environment indices. Skilled agricultural workers score lowest on the Earnings and Social environment indices. Workers in elementary occupations score lowest on the Prospects and Skills and discretion indices.
Job quality by country
There are significant differences in job quality scores between countries, which reflect different workforce compositions, institutional frameworks and regulations. Denmark, Finland, Luxembourg, the Netherlands and Norway report the highest job quality scores on the most dimensions, while the Western Balkan countries report the lowest job quality scores, on average.





‘The expected benefits of job quality are that it will support both productivity increases and sustainable and inclusive growth in Europe. Furthermore, the creation of high-quality jobs was identified in the Draghi report as a key enabling action to improve the EU innovation model.’
Chapter 4
Trends in job quality


The EWCS examines the trends over time in job quality for each of the seven job quality indices.

Earnings
- The scores on the Earnings index reflect the pervasive gender pay gap that is seen across sectors and occupations.
- A majority of workers (85%) can predict their earnings for the next three months, either accurately or approximately, while 15% of workers cannot predict their earnings at all.
- In 16 of the 35 countries included in the 2024 survey, fewer than half of all workers are sure of how much they will earn over the next three months.
- The percentage of workers who feel they are not paid appropriately according to their performance and efforts has been decreasing since 2005, from 35% down to 26%.
- In 2024, more female workers (30%) than male workers (24%) reported not being paid appropriately according to their efforts and performance.
Earnings index
Looking at the Earnings index scores of men and women by sector and occupational group, there is a clear gender gap across the board.
The only exception is for clerical workers, a group that tends to have a relatively smaller gender pay gap than other occupational groups and also relatively larger shares of both men and women reporting that they are able to accurately predict their earnings.

Working time quality
- The share of workers putting in long hours has decreased significantly. Since 2005, the percentage of workers sometimes putting in more than 10 hours a day has fallen from 37% to 28%, and the share of those working more than 48 hours a week has reduced from 19% to 11%.
- Workers are gaining increased flexibility and more control over their hours. However, while half of men have some control, only 43% of women do. The percentage of employees who are able to adapt their working hours has increased greatly since 2010.
- The share of workers on ‘atypical’ schedules, such as weekends or nights, has been decreasing since 2015. However, the share of people doing shift work has remained stable.
Clocking in: working hours vary
Long working week: Working 6 or 7 days per week is most common in Greece (38%), Italy (34%), Croatia (29%), Cyprus (21%), Portugal (20%) and Romania (19%).
Four-day week: Working four days per week in their main job is reported by 8% of all EU workers: 5% of men and 11% of women. This work pattern is more common in the Netherlands (26%) and in Belgium (13%).
Shift work: In 2024, 21% of workers worked shifts.
Nights: Some 17% of workers reported working two or more hours between 22:00 and 05:00 at least once a month.
Rest between working days: 1 out of every 5 workers reported not having 11 hours rest between 2 working days at least once over the month prior to the survey.
Working hours predictability: Most workers (59%) know in advance how many hours they will work the following month.
Working time arrangements: About half of the EU workforce (53%) have their working time arrangements set by the organisation they work for with no possibility of change.
Flexibility: 72% of men and 67% of women said it was easy to take an hour or two off during working hours to attend to personal or family matters.

Prospects
- An increasing number of workers agree that their job offers good career prospects. Since 2010, there has been a 17 percentage-point increase for both men and women. Nevertheless, the gender gap of 6 percentage points persists.
- Higher-skilled occupations like managers, professionals and technicians are more likely to report good prospects, while those in elementary occupations and skilled agricultural workers report the lowest levels of good prospects.
- The fear of job loss is relatively low overall (affecting 12% of women and 10% of men) and was less prevalent in 2024 than previously. Younger workers (15%) and those in elementary occupations are more likely to report job insecurity (17%).
- Uncertainty about the future is reflected in workers’ fear of an undesirable change in their work situation without losing their job: 15% of both men and women are expecting such a change, with larger shares of workers in the agriculture, health and transport sectors reporting this.
New question in EWCS 2024
To what extent would workers be afraid to ask if they wanted an improvement to their working conditions?
Some 25% of women and 21% of men reported that, if they wanted better working conditions, they would be afraid to ask. This situation is more often reported by workers in lower-skilled occupations.
In all occupations, with the exception of skilled agricultural workers (among whom the proportion of women is very low), women report poorer working conditions prospects than men.


Skills and discretion
- Since 2010, workers have increasingly reported that they have more opportunities to use and develop their skills, but the gender gap persists: men score higher than women on the Skills and discretion index.
- While skills use, development opportunities and access to training have improved, there has been a concerning decrease in workers’ ability to influence collective work processes and apply their own ideas.
- Despite overall positive developments, fewer than half of all workers (43%) report having enough opportunities to use their skills and knowledge in their work.
- About a quarter or fewer of workers always exercise various facets of autonomy. The area in which this is least frequent is having a say in the choice of work colleagues.
- Inequalities remain among occupational and age groups in terms of access to training: workers in higher-skilled occupations report more frequent, paid training opportunities; older workers (aged 55 or over) report less access to training than their younger colleagues.
- Some sectors with the largest shares of workers reporting that they receive training (health, public administration and financial services) also have the highest unmet training needs.
- Worker participation in organisational development varies significantly by sector. Employees in financial services, education, public administration and other services are more likely to be consulted on and involved in improving work processes, while those in agriculture, commerce and hospitality, and transport have fewer opportunities.
Skills in action: learning opportunities at work
Workers in higher-skilled occupations report more opportunities to practise and learn new skills in their work. The differences between occupations are largest in terms of making difficult decisions (62 percentage points) and performing complex tasks (49 percentage points), which could be a source of strain for workers.
Working in a language different from one’s mother tongue
Overall, 39% of men and 36% of women speak a foreign language in their work. Working in a language different from one’s mother tongue is more frequent for supervisors, younger workers and workers with less seniority.
Across sectors, 45% of workers in other services, 41% in financial services and 40% in commerce and hospitality use a foreign language at work.
Access to training
Training is highly valued by workers: 75% of those who have undertaken any type of training agree that the training they received improved their prospects for future employment.
There are significant differences in access to training across sectors. Regarding training that was paid for by the employer, this was received by 55% of employees in the health sector, 56% in the education sector and 62% in both the financial and public administration sectors; only a third or fewer received such training in commerce and hospitality and in agriculture.
‘Everyone has the right to quality and inclusive education, training and life-long learning in order to maintain and acquire skills that enable them to participate fully in society and manage successfully transitions in the labour market.’

Work intensity
- By sector, the best score is seen in agriculture (76 index points), while the health sector reports the poorest score (63 points), followed by financial services (64 points) (the lower the score, the higher the level of work intensity).
- By occupation, skilled agricultural workers score the highest (77 points), followed by those in elementary occupations (71 points), while managers and technicians (both at 64 points) score the lowest.
- Women are more likely than men to face high-speed work, frequent interruptions and higher emotional demands. This is largely because they are over-represented in professions that require extensive public interaction, such as health and education.
- The industrial sector has the highest number of workers with three or more factors determining their work pace, often driven by automatic systems.
- The health sector has the highest emotional demands, linked to frequent public interaction. Workers in this sector often have to hide their feelings, deal with angry clients and handle emotionally disturbing situations.
Emotional demands
Emotional demands are particularly relevant in roles that involve frequent interaction with clients, patients, customers, students or colleagues.
A quarter of workers report hiding their feelings always or most of the time; this rises to almost two in five workers (39%) in the health sector.
15% of workers face angry clients three quarters or more of the time.
On average, 1 in 10 workers report being in emotionally disturbing situations three quarters or more of the time.



Social environment
- Women’s Social environment index scores are consistently lower than men’s, due mainly to a greater exposure to adverse social behaviours.
- Despite relatively low overall prevalence, adverse social behaviours remain a significant concern, with certain Member States (including Belgium, Denmark, the Netherlands and Sweden) reporting higher than average rates of these behaviours.
- The reported experience of adverse social behaviours varies significantly across different demographic groups.
- Direct and frequent interaction with the public increases the likelihood of experiencing adverse social behaviours, particularly verbal abuse, threats and physical violence.
- Social support is generally high, with 73% of employees reporting support from colleagues, compared with 65% reporting support from managers.
- Social support from managers has increased by 7 percentage points since 2010.
- The transport sector shows the highest proportion of workers who report receiving support rarely or never. This lack of support may worsen the effects of high job demands in this sector.
Age and gender differences in reporting adverse social behaviours
Adverse social behaviours are most likely to be reported by the younger age cohort (16–29 years ), with the exception of bullying and cyberbullying, which are reported more evenly across all age groups.
In terms of gender, women experience all adverse social behaviours to a greater extent than men, except for physical violence and threats, for which no gender differences are observed.
Sector differences in reporting adverse social behaviours
The health sector stands out as having the highest percentage of workers subjected to the most forms of adverse social behaviour, including unwanted sexual attention (6%), threats and humiliating behaviours (both 10%), physical violence (8%) and sexual harassment (3%).
Cyberbullying is most prevalent in the education sector (4%), while bullying is an issue across all three public sectors, with public administration, health and education recording equally high prevalence rates of 7% each.
New question in EWCS 2024
How frequently do workers feel lonely at work?
Nearly 3 in 10 workers report feeling lonely at work always or most of the time (9%) or sometimes (19%). Plant and machine operators (15%) and skilled agricultural workers (14%) are the most likely to report feeling lonely at work always or most of the time.
Services and sales workers are less likely to experience loneliness, most likely thanks to the social demands inherent in their roles, with 7% reporting feelings of loneliness always or most of the time and 17% reporting these feelings sometimes.

Physical environment
- Overall, the quality of the physical work environment has been improving since 2010 for both men and women. The rate of improvement has been faster for men.
- The general improvement is due to a reduction in most physical risks and demands. However, exposure to high temperatures has increased, as has contact with chemical products and exposure to infectious materials, albeit to a lesser degree.
- There are gender differences in exposure to risks, with men more exposed to risks like vibrations, noise and heavy loads, while women are more exposed to risks posed by lifting people, sitting for prolonged periods and contracting infectious diseases.
- Occupational hazards are a concern for workers in specific fields, such as crafts, agriculture and machine operation, as they face a higher accumulation of multiple physical risks.
- Episodic exposure to high temperatures (25–75% of the time) has increased, potentially due to climate change. Men are more exposed to such episodic exposure than women (28% versus 13%, respectively). Workers in agriculture, construction, transport and industry are most affected.
- A significant percentage of workers, particularly women (42% versus 39% of men), report sitting for long periods.
Physical environment quality by occupation
In terms of exposure to physical risks and demands, the situations of craft workers, skilled agricultural workers and plant and machine operators are of particular concern, as these occupations involve high exposure to most physical risks and physical demands.
Services and sales workers report high exposure to high temperatures, painful positions, carrying and moving heavy loads and repetitive movements. Workers in higher-skilled occupations are most exposed to prolonged sitting.
Exposure to high temperatures
In 2024, 34% of men and 18% of women reported exposure to temperatures so high that they perspire even when they are not working.
Exposure to high temperatures all or more than three quarters of the time has remained relatively stable since 2010. This applies to people who are working in a very hot environment, for example in a foundry or kitchen. However, episodic exposure (between a quarter and three quarters of the time) has increased. The increase could point to the effects of climate change.
Is sitting the new smoking?
Many workers find themselves sitting at their desks and workstations for prolonged periods, mainly due to greater use of computers and the increased digitalisation of work processes. Prolonged sitting may lead to musculoskeletal disorders and health risks in other domains, such as diabetes, cardiovascular disease, depression and even mortality.
Stark differences between men and women are apparent in some sectors. This confirms that men and women often hold different functions within the same sector, leading to varying exposure to physical risks in the same sector, with construction being the most extreme example.

‘The overall picture confirms that the job quality dimensions and their interplay are strongly related to workers’ well-being, health and engagement, confirming the importance of job quality in supporting a sustainable working life.’
Chapter 5
Working life


Skills and employability
- In 2024, 13% of workers were underskilled and needed further training to cope well with their duties.
- Although most workers in the EU feel that it would be easy to find a similar job if they were to lose or quit their current job (58%), more than a quarter (28%) feel this would be rather unlikely. This figure is higher for those with a low level of education (34%).
Underskilled, overskilled or just the right level of skills?
The concept of the ‘skills match’ refers to the optimal alignment between a worker's potential and the specific requirements of a job role or task. A mismatch (being over- or underskilled) is associated with an inefficient use of human capabilities.
In 2024, the proportion of self-perceived underskilling in the EU was 13%, with almost no differences between men and women. It ranged from 2% in Portugal to 29% in Austria. Overskilling was reported by 30% of workers in the EU, with the proportion ranging from 18% in Malta to 44% in Romania.
Both under- and overskilling have implications for health
When workers’ skills are underutilised, they are unable to contribute their full potential and may not be fully engaged in their work. Conversely, when workers lack the necessary skills to perform their job effectively and this is not adequately addressed, their health is negatively affected.
Underskilled workers are more likely to report poor health, stress, negative health effects of their work and lower levels of mental well-being. However, overskilled workers also have worse health and well-being outcomes than those with the right skills for the job.
Should I stay or should I go?
74% of employees state that it is unlikely or very unlikely that they will leave their job during the next year.
Among younger workers (aged 16–29 years), 29% consider it likely that they will leave their job over the next year.
In terms of sectors, 25% of workers in elementary occupations and 21% of those working in commerce and hospitality state that it is likely they will leave their job over the next year.

Financial sustainability
8%
Overall, some 8% of workers in the EU reported that it was difficult or very difficult to make ends meet. The share of workers struggling to make ends meet varies greatly between countries.
Geographical pattern in ability to make ends meet
A clear geographical pattern emerges, with Denmark, Finland and Sweden consistently showing low proportions of individuals struggling financially, whereas some eastern and southern European countries tend to have higher proportions of workers facing economic difficulties.
Household composition and level of financial vulnerability
43%
Lone parents are disproportionately affected by financial hardship: 43% report difficulty in making ends meet. Lone mothers are particularly vulnerable, with 46% experiencing financial difficulties.
31–37%
Workers in households with children tend to face greater financial challenges, with 31–37% struggling to make ends meet, followed by single-person households of prime working age, with 28% reporting difficulties.





Reconciling work and private life
- Gender inequalities persist in unpaid work, regardless of household composition. In most settings, women continue to carry a disproportionate share of the responsibility for childcare, the care of relatives and housework.
- In 2024, 83% of EU workers reported a good fit between their working hours and other, non-work commitments.
- Employees have a better work–life balance than self-employed individuals.
- Agriculture stands out as the sector with the largest shares of workers who have to change their private and family activities due to work-related requests, who continue to worry about work when they are not working and who feel too tired after work to do some of the household jobs that need to be done.
- Most workers in the EU (56%) report that they would like to work the same number of hours that they are currently working, but the share of those preferring to work fewer hours increased from 27% in 2015 to 33% in 2024.
Working women still shoulder most of the care and domestic work
62%
Approximately 62% of women provide regular care for children and 26% care for relatives. Corresponding shares among men are considerably lower, at 56% and 20%, respectively.
96%
The gender gap is even more pronounced in terms of housework. Almost all women (96%) report doing housework regularly compared with only 73% of men. Notably, 12% of men report never engaging in housework, whereas this is just 1% among women.
Slow but steady improvement in work–life balance
Gender differences are small, but women are more likely than their male counterparts to report a good fit between their job and other areas of their life (85% versus 82%, respectively). Trend data show a slow but steady improvement for both in this respect: the shares of women and men reporting their working hours fitting very well or well with their family or social commitments increased from 83% and 79%, respectively, in 2010, to 85% and 82%, respectively, in 2024.
When work spills over into life
47%
of workers never had to change their private and family activities due to work-related requests; 4% did so at least several times a week.
15%
of workers worry about work in their free time.
22%
of workers feel tired after work.
27%
of workers in agriculture worry about work when not working.






Workers’ health and well-being
- Musculoskeletal problems are the most prevalent health issues (reported by 52% of workers), and occupation is a factor in the reporting of health problems.
- More women than men report health problems, with the largest gender differences in self-reported health problems being for headaches and eyestrain (54% of women and 41% of men) and anxiety (26% of women and 16% of men).
- More women (23%) than men (18%) and more older workers of core age (30–54 years) (21%) and of pre-retirement age (55–64 years) (24%) than younger workers (16–29 years) (18%) are likely to report experiencing sleep difficulties daily or several times a week.
- Some 28% of workers feel physically exhausted and 13% feel emotionally exhausted always or most of the time.
- About 26% of workers in the EU report that their health or safety is at risk because of work, a figure that has remained relatively unchanged since 2010.
- Workers aged 55–64 years are more likely to report extended sick leave (17%) compared with those under the age of 55 (13%). Home-based teleworkers are more likely to report presenteeism than those who work solely at their employer’s premises (over 40% compared with 27%).
- 14% of EU workers report being ‘not very well informed’ or ‘not at all well informed’ about health and safety risks at work; 29% report being unaware of measures to prevent work-related stress.
Sleep a problem for a significant minority
Some 21% of workers reported experiencing sleeping difficulties daily or several times a week in the month prior to the survey. A gender gap is apparent, with relatively more women (23%) than men (18%) having difficulties sleeping. Such gender gaps are largest among managers, professionals, clerical workers, skilled agricultural workers and those in elementary occupations.
In terms of physical and emotional exhaustion, considerable differences emerge among countries. The highest shares of workers who feel emotionally and physically exhausted always or most of the time are found in Cyprus, while the lowest shares are observed in the Netherlands.
Health and safety at work
In 2024, about 26% of workers in the EU reported that they thought their health was at risk because of work, with similar proportions observed in 2010 and 2015. Spain and Sweden have seen the greatest increases since 2010 in the share of workers reporting that their health or safety is at risk because of work.
In contrast, Malta and several eastern European countries, such as Bulgaria, Croatia, Hungary, Romania and Slovenia, have seen the opposite trend.


Prevalence of work-related health risk by sector, 2010–2024 (%)
In terms of sector, health, agriculture, transport and construction are the areas in which respondents are most likely to report risk to their health related to work.
The situation has improved over time (2010, 2015, 2024) in construction but has disimproved in agriculture, transport, health and public administration compared with 2015.

Trust, engagement and motivation
- Most workers agree that there is trust between employees and management, that conflicts are resolved fairly and that the health and well-being of employees are prioritised in their organisation.
- Health, education and financial services are the sectors with the highest levels of .. Industry and commerce and hospitality have the lowest levels.
- Self-employed individuals tend to exhibit higher levels of engagement than employees.
- The proportion of workers stating that their organisation motivates them to give their best job performance increased from 61% in 2010 to 68% in 2024.
- The largest shares of workers disagreeing that their organisation motivates them are in transport and public administration (both 17%), followed by health and industry (both 16%). Construction (76%) and financial services (77%) are the sectors with the highest proportions of workers motivated by their organisation.
Trust in the workplace
74%
of employees agree that employees trust management to do their work well.
86%
agree that, in general, management trusts their employees to do their work well.
75%
believe that, generally, conflicts are resolved fairly.
72%
of employees agree that their organisation prioritises the health and well-being of its employees.do
Work engagement
The EWCS results paint a generally positive picture across the EU. However, since 2015, overall engagement has gone down: 36% of workers reported high engagement in 2015, 35% in 2024. At the same time, the proportion of low engagement increased from 25% to 28%. The biggest drops in engagement levels were observed among craft workers (4.3 percentage points), clerical workers (3.1 percentage points) and professionals (3 percentage points).
In 2024, more than two thirds of workers (68%) reported feeling full of energy always or most of the time and that they were enthusiastic about their job (70%), while 73% reported feeling that time flies at work.

Meaningful work
- For most workers, their job is meaningful. The different aspects of meaningful work are all linked to job quality. Workers reporting positive experiences as regards these aspects also achieve higher scores for almost all job quality indices. They report higher levels of engagement, trust, well-being and motivation.
85%
of workers find their work useful always or most of the time.
83%
experience a feeling of work well done always or most of the time.
68%
of workers strongly agree or tend to agree that they receive the recognition they deserve for their work.
85%
of workers feel fairly treated in their workplaces always or most of the time.
44%
never do things at work that they disapprove of, but 30% say they do sometimes or more often.
Health and education continue to be the sectors with by far the largest proportions of workers reporting that they do useful work, while workers in commerce and hospitality and in industry report it the least.




Work sustainability
- Men between the ages of 16 and 54 value good pay and benefits most, while a safe working environment for mental and physical health is the most important aspect for women aged between 16 and 64.
- In the EU, around 1 in 5 respondents aged 45 or over would like to work ‘as long as possible’, while 1 in 10 responded they would like to retire ‘as early as possible’.
- 87% of workers in the EU aged between 45 and 54 believe they could continue working in their current job or a similar one until the age of 60 (among those who did not reply ‘don’t know’ to the question).
- Among those aged 55 or over, 74% of respondents were confident that they could continue working in their current or a similar job for at least five more years.
- In terms of occupation, more than 78% of technicians, clerical workers, professionals and managers indicated they would be able to work until the age of 60, compared with fewer than 60% of those in elementary occupations.
Safe and trusting environment vital for workers
A safe working environment for mental and physical health and a trusting working environment are the most important aspects of work for 71% and 69% of workers, respectively. The top aspect for self-employed individuals is being able to use their own initiative at work (marked as very important by 73% of all self-employed individuals), on a par with a safe working environment (also 73%) and followed by a trusting working environment (69%).
Preferred age for retirement
To capture workers’ motivation to stay in employment, the EWCS asked respondents aged 45 years or older until what age they would like to work.
68%
of workers mentioned a specific age.
21%
stated they would work as long as possible.
12%
in the age group indicated they would retire as early as possible.
63.9
years was the average desired retirement age for men.
63.1
years was the average desired retirement age for women.




Conclusions
Job quality is improving in Europe. Four of the seven job quality indices have improved since 2010: Prospects, Skills and discretion, Working time quality and Physical environment. Some slight deterioration is observed for the Social environment and Work intensity indices. The Earnings index cannot be compared over time.
Both the digital and green transitions have a direct impact on the world of work, bringing new challenges but also opportunities. As regards technology use, the EWCS 2024 shows that a new gender divide could be opening, given the differences in the adoption of technologies.
One clear impact of the twin transition is the need to ensure that workers have the right skills to deal with changing technologies and the associated change in tasks. The results of the EWCS 2024 show an increase in the use of skills at work and improved access to training. However, this positive trend has not eliminated skills mismatches.
Most workers in the 2024 survey report that their job is meaningful. More than 80% find their work useful, experience a feeling of work well done and feel fairly treated in their workplace always or most of the time. Just over two thirds agree that they receive the recognition they deserve for their job.
The overall progress that has been made does not seem to reach all parts of the EU workforce. This adds to fundamental inequalities in the quality of the jobs of different individuals. To reap the benefits of job quality – such as better health and well-being, motivation, engagement and creative power – it is crucial to ensure that improvements in job quality are felt by all members of an increasingly diverse workforce.
The policy goal of improving job quality must recognise its multidimensionality. The findings point to the need for a more integrated and holistic approach to improving job quality – through actions implemented at EU and national levels – that is complemented by a sector-specific and even company-specific approach that takes account of the needs of certain occupations and jobs.
The EWCS shows that there has been progress on job quality, but also that there have been different job quality trajectories for men and women. The job quality enjoyed by men is greater than that of women in Skills and discretion, Work intensity, Social environment, Prospects and Earnings. The job quality of women is better than that of men in terms of the Physical environment and Working time quality indices.
A safe working environment for mental and physical health is rated as the most important aspect of work in general. Second is a trusting work environment. At the same time, in 2024, just over a quarter of workers reported that their health and safety is at risk because of their work.





Podcast
Eurofound Talks
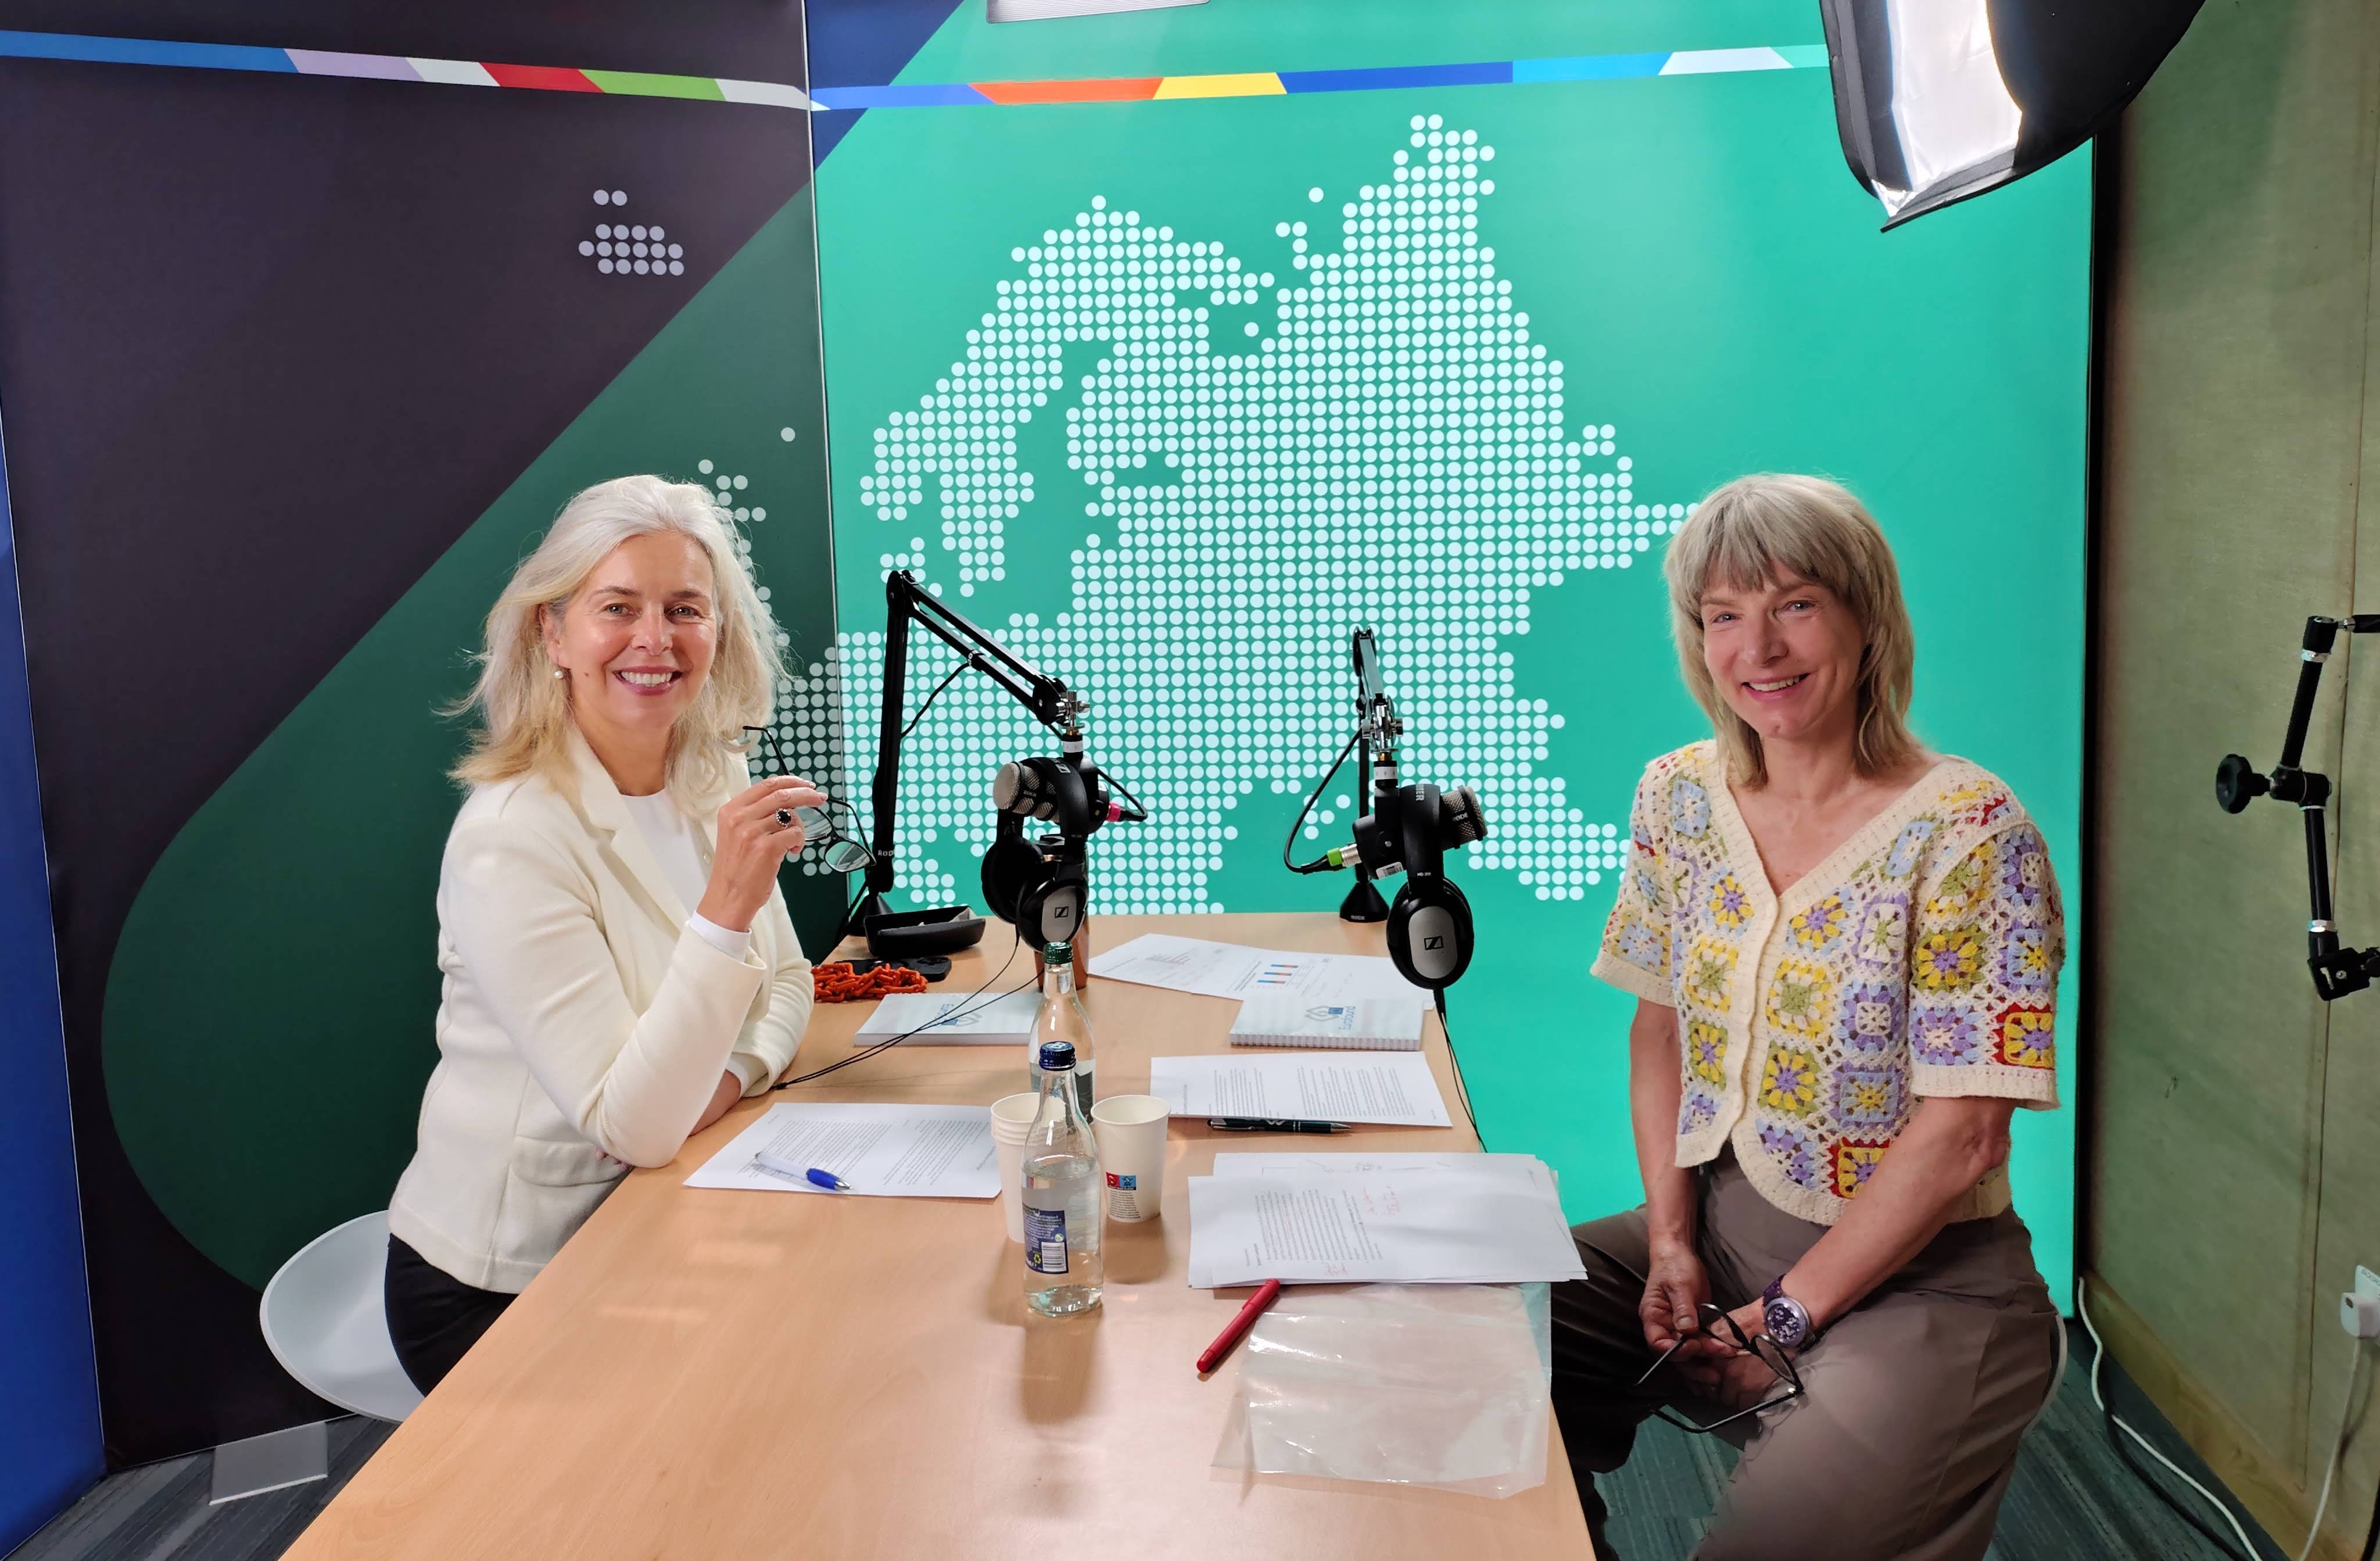
Listen to the Eurofound Talks podcast episode on the findings with Head of Unit for Working Life, Barbara Gerstenberger.

'Video
What is the EWCS?
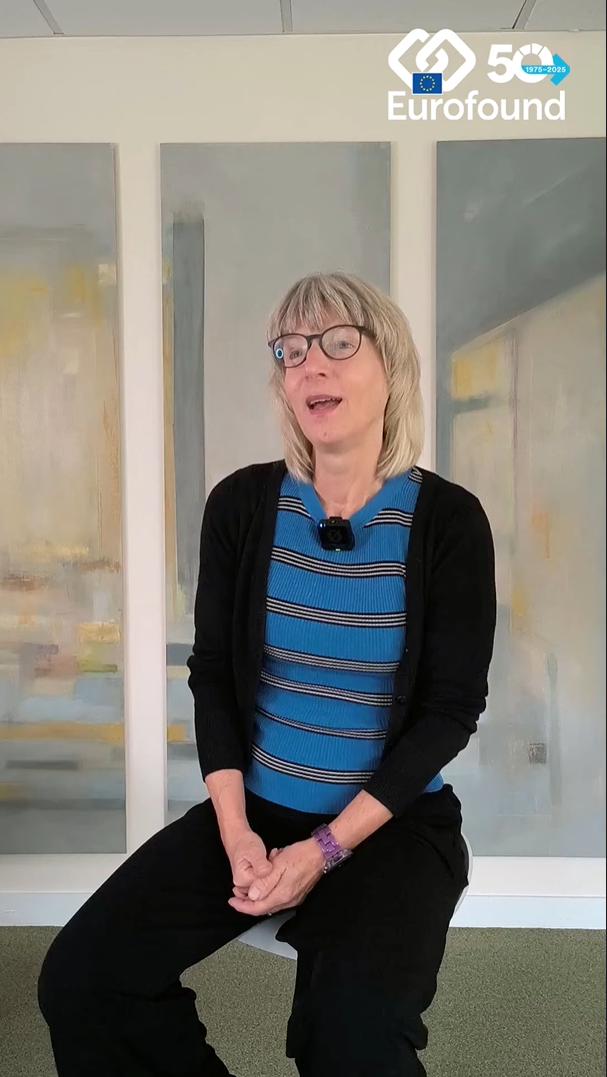
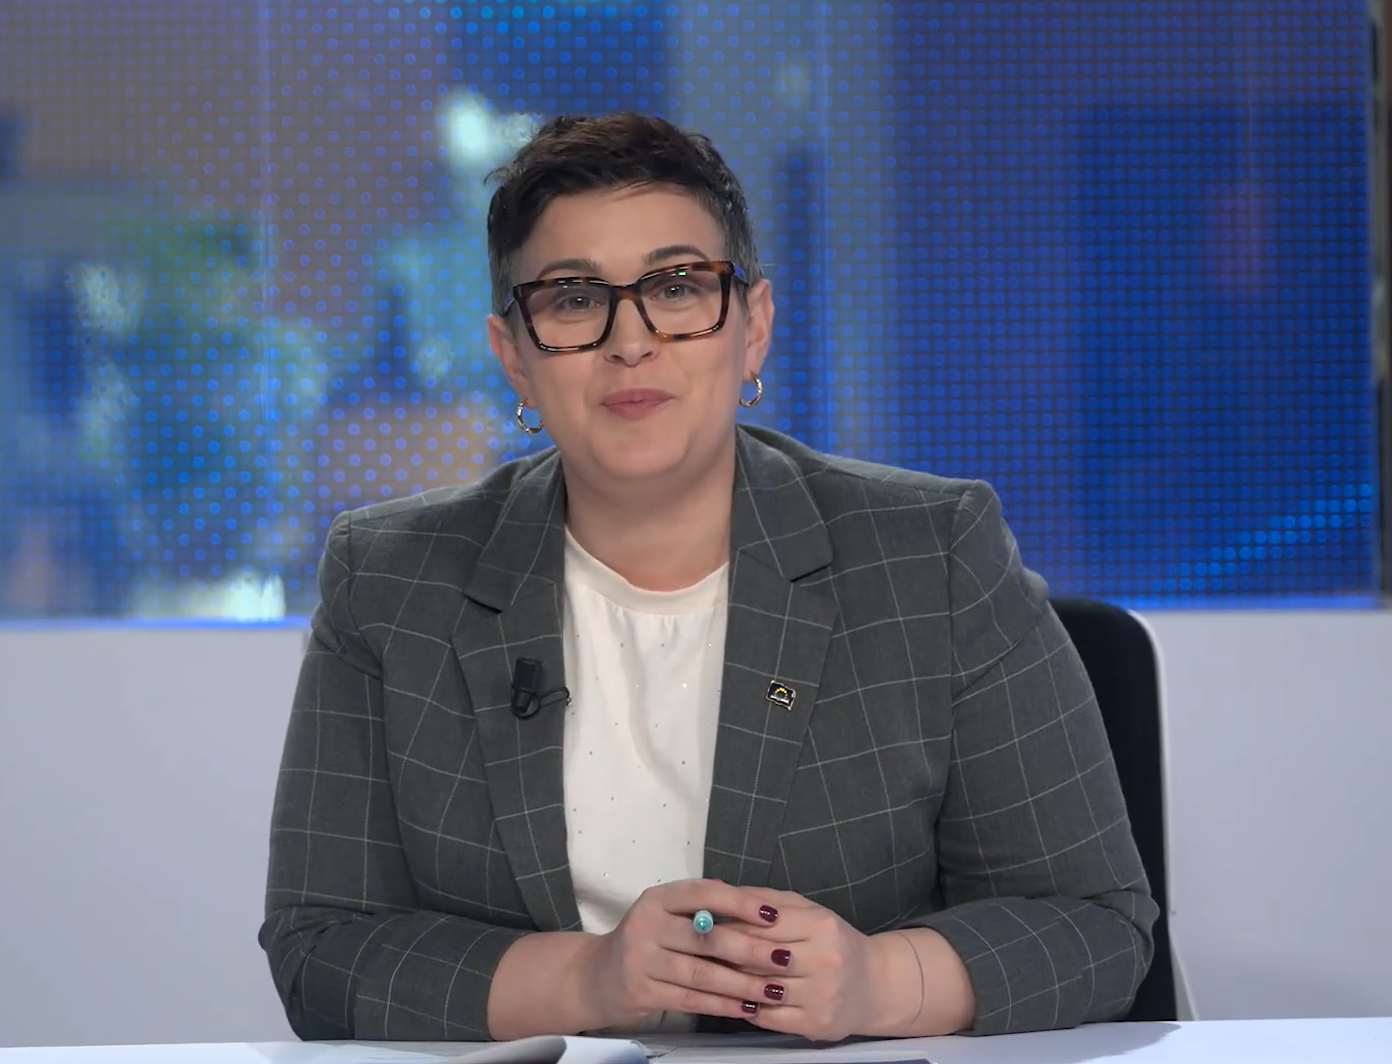
In this short video, Barbara Gerstenberger explains what the European Working Conditions Survey is all about.

Video
Is work in Europe more stressful for women?
In this 'Behind the podcast' video, Maria Walsh MEP and Barbara Gerstenberger analyse some of the main gender equality findings.


Q&A
Ask the Expert
Watch this interactive webinar on how working conditions and inequalities are changing in Europe post-pandemic.


Digital story
First findings
A new world of work – challenges and opportunities
Read more about the findings in our other digital story on digitalisation, shifting expectations, and demographic change.


Digital story
First findings
Trends in job quality
Read more about the findings in our other digital story on job quality in the EU.
Ask the experts


Barbara Gerstenberger
Barbara Gerstenberger is Head of the Working Life unit at Eurofound. In this role, she coordinates the research teams investigating job quality in Europe based on the European Working Conditions Survey.

Agnès Parent-Thirion
Agnès Parent-Thirion is a senior research manager in the Working Life unit, tasked with the planning, development and implementation of working conditions research projects, in particular the European Working Conditions Survey and its analyses.

Jorge Cabrita
Jorge Cabrita is a senior research manager in the Working Life unit. He is responsible for formulating, coordinating and managing European-wide research, and promoting the dissemination of findings in the areas of working conditions and industrial relations.

Franz Ferdinand Eiffe
Franz Eiffe is a research manager in the Working Life unit at Eurofound. He is involved in projects on sustainable work, quantitative analyses and upward convergence in the EU.


Sara Riso
Sara Riso is a senior research manager in the Working Life unit. She is engaged in projects focusing on digitalisation and working conditions, exploring new workplace stressors arising from increased digitalisation, evolving organisational practices, and change management strategies.

Karel Fric
Karel Fric is a research officer in the Social Policies unit. His work involves survey research, data analysis and project management, with a particular focus on working and living conditions, equality and discrimination.
John Hurley
John Hurley is a senior research manager in the Employment unit. His main research interests are in the areas of comparative labour market analysis, restructuring and the changing world of work.

Christopher White
Chris White is a survey data officer, based in the Employment unit. He is tasked with providing support for all three of Eurofound's surveys: the EWCS, EQLS and ECS.
Photo credits (in order of appearance)
Title: © Valerii Apetroaiei/Adobe Stock
Chapter 1: 1: © Gorodenkoff/Adobe Stock; 2: © bernardbodo/Adobe Stock; 3. © Inti St. Clair/Adobe Stock; 4: © Andrey Popov/Adobe Stock; 5: © Monkey Business/Adobe Stock; 6. © amixstudio/Adobe Stock; 7. © DimaBerlin/Adobe Stock
Chapter 2: 1: © pressmaster/Adobe Stock; 2: © N F/peopleimages.com/Adobe Stock; 3: © standret/Adobe Stock; 4: © Drazen/Adobe Stock; 5: © Rido/Adobe Stock
Chapter 3: 1: © Mulderphoto/Adobe Stock; 2: © Friends Stock/Adobe Stock; 3: © master1305/Adobe Stock; 4: © kerkezz/Adobe Stock; 5: © DC Studio/Adobe Stock; 6: © BelénMenta/Adobe Stock
Chapter 4: 1: © NT_studio/Adobe Stock; 2: © Mikhail Nilov on Pexels; 3: © Helena Lopes on Pexels; 4: © Yasin Onuş on Pexels
Chapter 5: 1: © Rido/Adobe Stock; 2: © JackF/Adobe Stock; 3: © JackF/Adobe Stock; 4: © Pics4u/Adobe Stock; 5: © nimito/Adobe Stock; 6. © Rawpixel.com/Adobe Stock; 7. © Soloviova Liudmyla/Adobe Stock; 8. Video: © Bettencourt/peopleimages.com/Adobe Stock; 9. © Jacob Lund/Adobe Stock; 10. © Mediaphotos/Adobe Stock; 11. © Jacob Lund/Adobe Stock; 12. © ChasingMagic25peopleimages.com/Adobe Stock; 13. © Halfpoint / Adobe Stock; 14. © insta_photos/Adobe Stock
Conclusions: 1: © Gorodenkoff/Adobe Stock; 2: © DisobeyArt/Adobe Stock
 Built with Shorthand